| Red | Green | Blue | |
| z | 17.64 | ||
| znorm | Inf | ||
| sky | -NaN | -NaN | -Inf |
| S/N | 28.7 | 48.2 | 51.2 |
| S/N(c) | 0.0 | 0.0 | 0.0 |
| SN(E/C) |

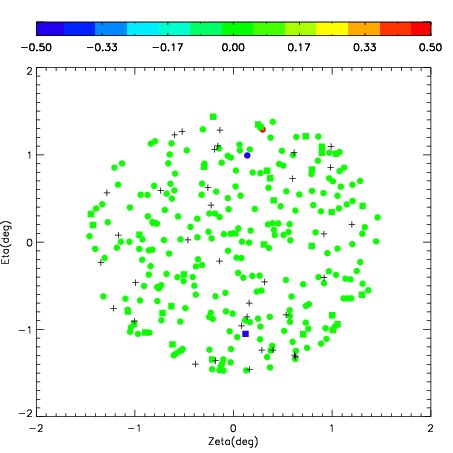
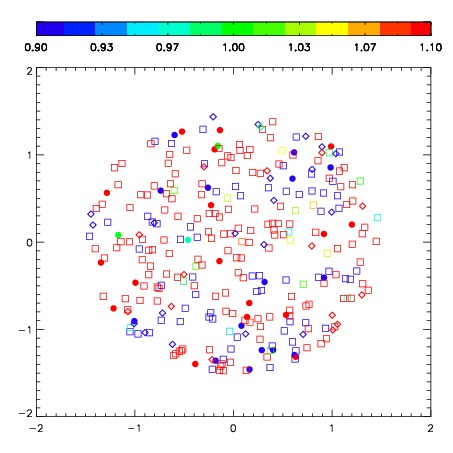

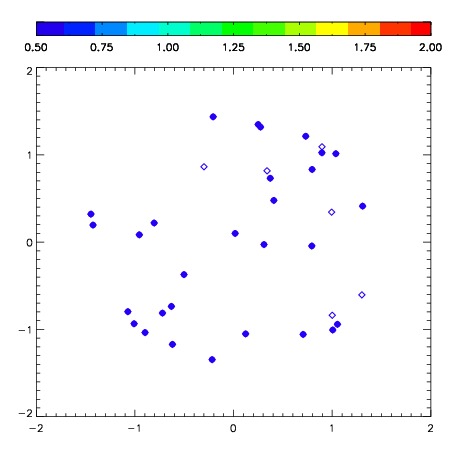
| Frame | Nreads | Zeropoints | Mag plots | Spatial mag deviation | Spatial sky 16325A emission deviations (filled: sky, open: star) | Spatial sky continuum emission | Spatial sky telluric CO2 absorption deviations (filled: H < 10) | |||||||||||||||||||||||
| 0 | 0 |
|
|
|
|
|
|
| IPAIR | NAME | SHIFT | NEWSHIFT | S/N | NAME | SHIFT | NEWSHIFT | S/N |
| 0 | 06970013 | 0.419945 | 0.00000 | 275.513 | 06970018 | 0.00666703 | 0.413278 | 273.873 |
| 1 | 06970012 | 0.416898 | 0.00304699 | 280.673 | 06970015 | 0.00728336 | 0.412662 | 280.946 |
| 2 | 06970017 | 0.418397 | 0.00154799 | 279.649 | 06970014 | 0.00560227 | 0.414343 | 280.183 |
| 3 | 06970016 | 0.413502 | 0.00644299 | 278.764 | 06970011 | 0.00000 | 0.419945 | 279.353 |