| Red | Green | Blue | |
| z | 17.64 | ||
| znorm | Inf | ||
| sky | -NaN | -NaN | -Inf |
| S/N | 24.9 | 40.7 | 46.7 |
| S/N(c) | 0.0 | 0.0 | 0.0 |
| SN(E/C) |


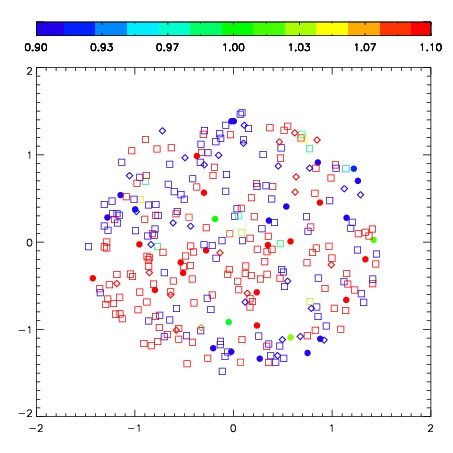


| Frame | Nreads | Zeropoints | Mag plots | Spatial mag deviation | Spatial sky 16325A emission deviations (filled: sky, open: star) | Spatial sky continuum emission | Spatial sky telluric CO2 absorption deviations (filled: H < 10) | |||||||||||||||||||||||
| 0 | 0 |
|
|
|
|
|
|
| IPAIR | NAME | SHIFT | NEWSHIFT | S/N | NAME | SHIFT | NEWSHIFT | S/N |
| 0 | 06640027 | 0.323595 | 0.00000 | 163.895 | 06640025 | 0.00000 | 0.323595 | 163.979 |
| 1 | 06640026 | 0.321629 | 0.00196600 | 168.254 | 06640028 | -0.0226877 | 0.346283 | 170.471 |
| 2 | 06640031 | 0.321217 | 0.00237799 | 165.699 | 06640029 | -0.0197357 | 0.343331 | 165.514 |
| 3 | 06640030 | 0.322652 | 0.000942975 | 158.351 | 06640032 | -0.0217929 | 0.345388 | 163.070 |