| Red | Green | Blue | |
| z | 17.64 | ||
| znorm | Inf | ||
| sky | -NaN | -Inf | -Inf |
| S/N | 26.1 | 41.0 | 47.6 |
| S/N(c) | 0.0 | 0.0 | 0.0 |
| SN(E/C) |
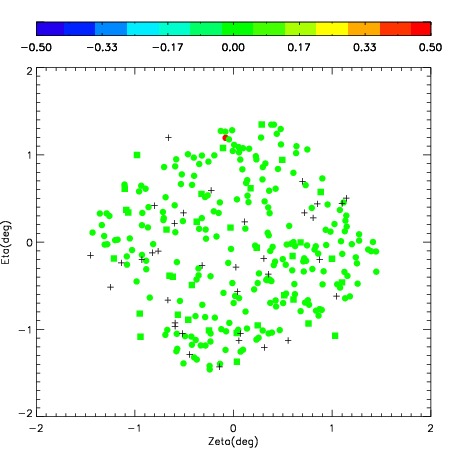
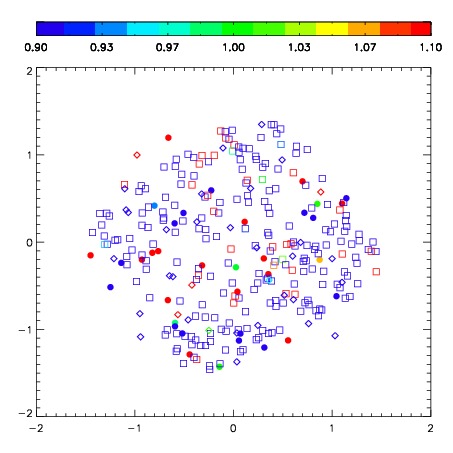


| Frame | Nreads | Zeropoints | Mag plots | Spatial mag deviation | Spatial sky 16325A emission deviations (filled: sky, open: star) | Spatial sky continuum emission | Spatial sky telluric CO2 absorption deviations (filled: H < 10) | |||||||||||||||||||||||
| 0 | 0 |
|
|
|
|
|
|
| IPAIR | NAME | SHIFT | NEWSHIFT | S/N | NAME | SHIFT | NEWSHIFT | S/N |
| 0 | 08490050 | 0.484920 | 0.00000 | 231.179 | 08490051 | 0.0425458 | 0.442374 | 235.705 |
| 1 | 08490049 | 0.484354 | 0.000566006 | 239.111 | 08490052 | 0.0426534 | 0.442267 | 241.831 |
| 2 | 08490054 | 0.455847 | 0.0290730 | 236.653 | 08490048 | 0.00000 | 0.484920 | 239.248 |
| 3 | 08490053 | 0.465424 | 0.0194960 | 236.184 | 08490055 | 0.0405568 | 0.444363 | 236.877 |