| Red | Green | Blue | |
| z | 17.64 | ||
| znorm | Inf | ||
| sky | -NaN | -NaN | -Inf |
| S/N | 18.7 | 28.6 | 33.9 |
| S/N(c) | 0.0 | 0.0 | 0.0 |
| SN(E/C) |

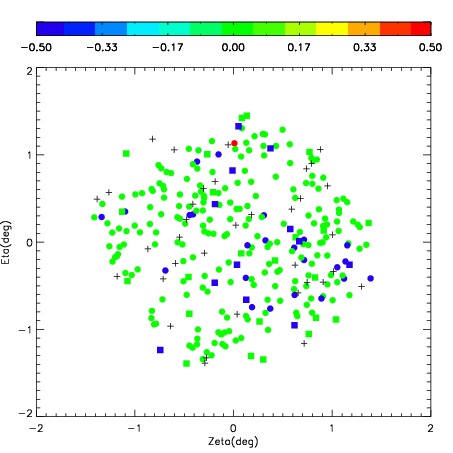
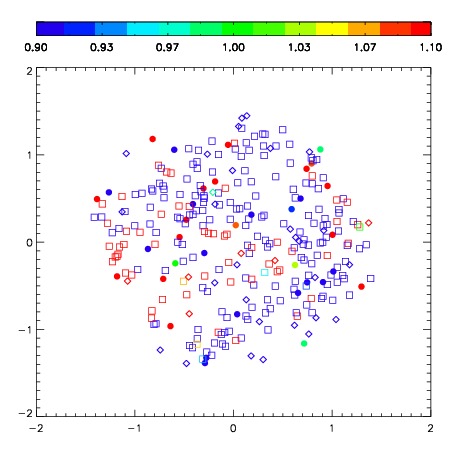
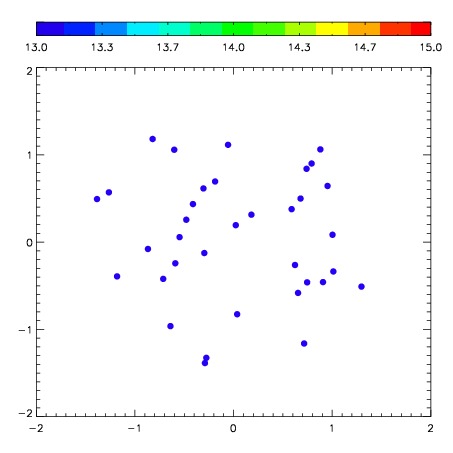

| Frame | Nreads | Zeropoints | Mag plots | Spatial mag deviation | Spatial sky 16325A emission deviations (filled: sky, open: star) | Spatial sky continuum emission | Spatial sky telluric CO2 absorption deviations (filled: H < 10) | |||||||||||||||||||||||
| 0 | 0 |
|
|
|
|
|
|
| IPAIR | NAME | SHIFT | NEWSHIFT | S/N | NAME | SHIFT | NEWSHIFT | S/N |
| 0 | 08770075 | 0.338896 | 0.00000 | 258.638 | 08770072 | 0.0205548 | 0.318341 | 272.811 |
| 1 | 08770070 | 0.327854 | 0.0110420 | 282.969 | 08770069 | 0.00000 | 0.338896 | 277.733 |
| 2 | 08770074 | 0.326718 | 0.0121780 | 272.411 | 08770073 | 0.0185683 | 0.320328 | 274.082 |
| 3 | 08770071 | 0.296461 | 0.0424350 | 0.00000 | 08770076 | 0.0185312 | 0.320365 | 266.392 |