| Red | Green | Blue | |
| z | 17.64 | ||
| znorm | Inf | ||
| sky | -Inf | -Inf | -Inf |
| S/N | 23.9 | 42.9 | 45.2 |
| S/N(c) | 0.0 | 0.0 | 0.0 |
| SN(E/C) |


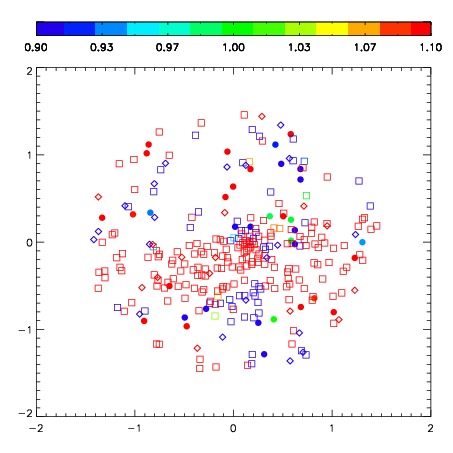


| Frame | Nreads | Zeropoints | Mag plots | Spatial mag deviation | Spatial sky 16325A emission deviations (filled: sky, open: star) | Spatial sky continuum emission | Spatial sky telluric CO2 absorption deviations (filled: H < 10) | |||||||||||||||||||||||
| 0 | 0 |
|
|
|
|
|
|
| IPAIR | NAME | SHIFT | NEWSHIFT | S/N | NAME | SHIFT | NEWSHIFT | S/N |
| 0 | 06330040 | 0.369868 | 0.00000 | 265.340 | 06330039 | 0.00130381 | 0.368564 | 269.578 |
| 1 | 06330036 | 0.368213 | 0.00165501 | 263.160 | 06330042 | -0.00562517 | 0.375493 | 266.426 |
| 2 | 06330041 | 0.368728 | 0.00114000 | 259.654 | 06330038 | 6.99759e-05 | 0.369798 | 261.007 |
| 3 | 06330037 | 0.360901 | 0.00896701 | 249.376 | 06330035 | 0.00000 | 0.369868 | 253.071 |