| Red | Green | Blue | |
| z | 17.64 | ||
| znorm | Inf | ||
| sky | -Inf | -NaN | -Inf |
| S/N | 22.1 | 38.9 | 42.2 |
| S/N(c) | 0.0 | 0.0 | 0.0 |
| SN(E/C) |
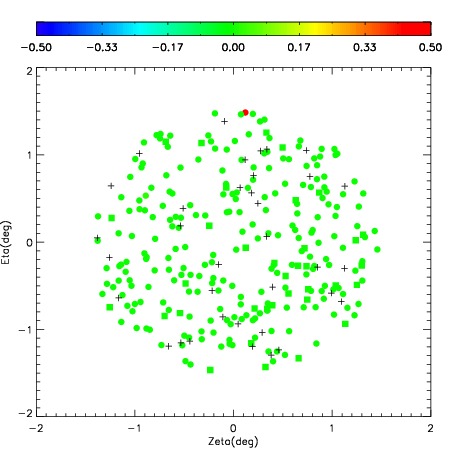
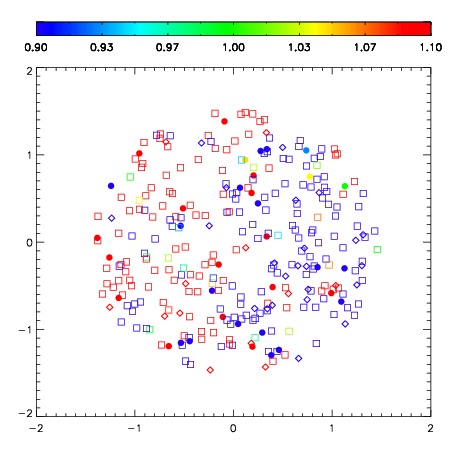


| Frame | Nreads | Zeropoints | Mag plots | Spatial mag deviation | Spatial sky 16325A emission deviations (filled: sky, open: star) | Spatial sky continuum emission | Spatial sky telluric CO2 absorption deviations (filled: H < 10) | |||||||||||||||||||||||
| 0 | 0 |
|
|
|
|
|
|
| IPAIR | NAME | SHIFT | NEWSHIFT | S/N | NAME | SHIFT | NEWSHIFT | S/N |
| 0 | 09980041 | 0.537910 | 0.00000 | 227.889 | 09980040 | 0.0693610 | 0.468549 | 215.238 |
| 1 | 09980037 | 0.520738 | 0.0171720 | 247.343 | 09980036 | 0.00000 | 0.537910 | 250.318 |
| 2 | 09980038 | 0.526980 | 0.0109300 | 240.828 | 09980039 | 0.0548451 | 0.483065 | 239.652 |
| 3 | 09980042 | 0.536949 | 0.000961006 | 209.459 | 09980043 | 0.0609711 | 0.476939 | 206.963 |