| Red | Green | Blue | |
| z | 17.64 | ||
| znorm | Inf | ||
| sky | -Inf | -Inf | -Inf |
| S/N | 27.7 | 46.8 | 51.0 |
| S/N(c) | 0.0 | 0.0 | 0.0 |
| SN(E/C) |

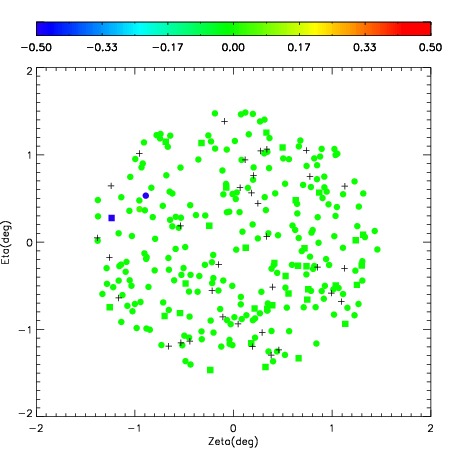
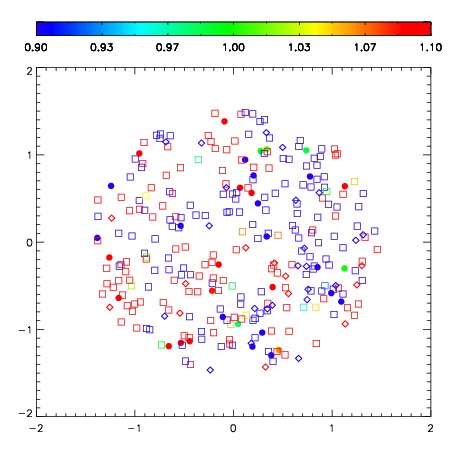
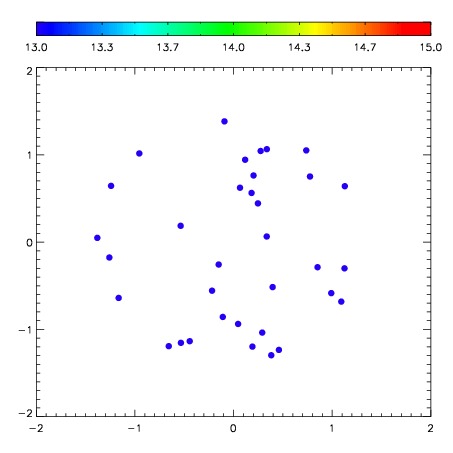

| Frame | Nreads | Zeropoints | Mag plots | Spatial mag deviation | Spatial sky 16325A emission deviations (filled: sky, open: star) | Spatial sky continuum emission | Spatial sky telluric CO2 absorption deviations (filled: H < 10) | |||||||||||||||||||||||
| 0 | 0 |
|
|
|
|
|
|
| IPAIR | NAME | SHIFT | NEWSHIFT | S/N | NAME | SHIFT | NEWSHIFT | S/N |
| 0 | 10150054 | 0.412508 | 0.00000 | 264.102 | 10150055 | 0.00802903 | 0.404479 | 265.472 |
| 1 | 10150053 | 0.412373 | 0.000135005 | 263.667 | 10150048 | 0.00000 | 0.412508 | 262.055 |
| 2 | 10150049 | 0.412074 | 0.000434011 | 257.328 | 10150052 | 0.0137886 | 0.398719 | 259.549 |
| 3 | 10150050 | 0.411335 | 0.00117302 | 254.927 | 10150051 | 0.00748144 | 0.405027 | 259.199 |