| Red | Green | Blue | |
| z | 17.64 | ||
| znorm | Inf | ||
| sky | -Inf | -Inf | -Inf |
| S/N | 26.9 | 45.0 | 48.7 |
| S/N(c) | 0.0 | 0.0 | 0.0 |
| SN(E/C) |


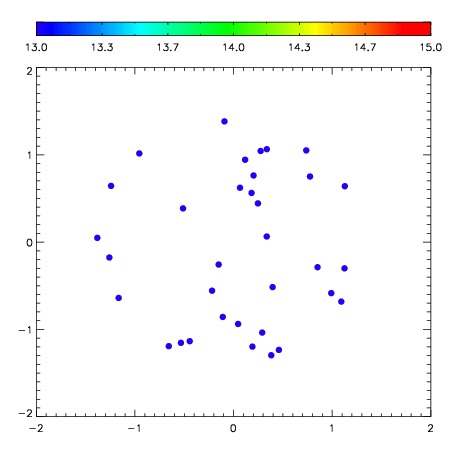
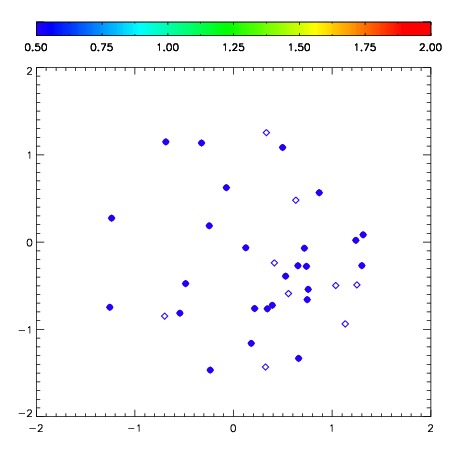
| Frame | Nreads | Zeropoints | Mag plots | Spatial mag deviation | Spatial sky 16325A emission deviations (filled: sky, open: star) | Spatial sky continuum emission | Spatial sky telluric CO2 absorption deviations (filled: H < 10) | |||||||||||||||||||||||
| 0 | 0 |
|
|
|
|
|
|
| IPAIR | NAME | SHIFT | NEWSHIFT | S/N | NAME | SHIFT | NEWSHIFT | S/N |
| 0 | 10240039 | 0.402025 | 0.00000 | 256.366 | 10240044 | 0.00618364 | 0.395841 | 254.217 |
| 1 | 10240038 | 0.397576 | 0.00444901 | 258.278 | 10240037 | 0.00000 | 0.402025 | 257.791 |
| 2 | 10240042 | 0.399140 | 0.00288501 | 257.408 | 10240041 | 0.00324550 | 0.398780 | 255.220 |
| 3 | 10240043 | 0.401050 | 0.000975013 | 256.078 | 10240040 | 0.00396609 | 0.398059 | 253.141 |