| Red | Green | Blue | |
| z | 17.64 | ||
| znorm | Inf | ||
| sky | -NaN | -NaN | -Inf |
| S/N | 23.1 | 41.5 | 44.7 |
| S/N(c) | 0.0 | 0.0 | 0.0 |
| SN(E/C) |

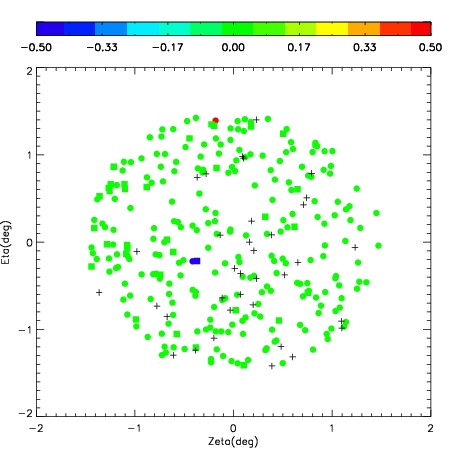
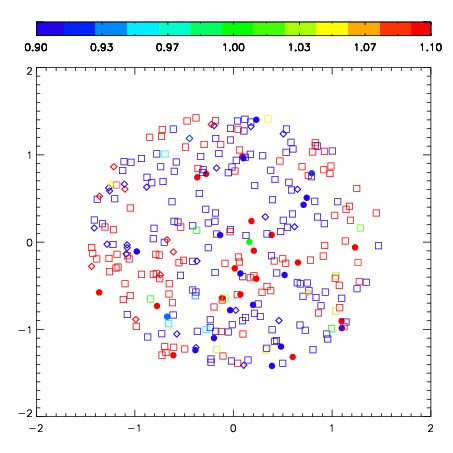
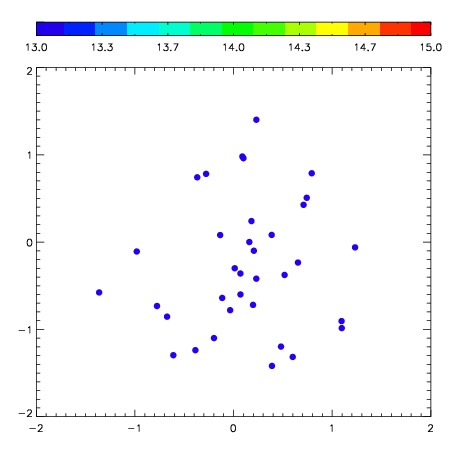
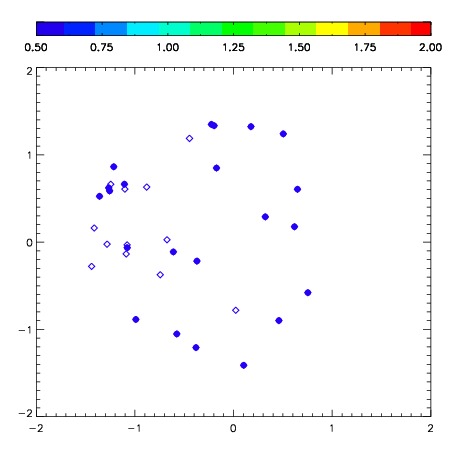
| Frame | Nreads | Zeropoints | Mag plots | Spatial mag deviation | Spatial sky 16325A emission deviations (filled: sky, open: star) | Spatial sky continuum emission | Spatial sky telluric CO2 absorption deviations (filled: H < 10) | |||||||||||||||||||||||
| 0 | 0 |
|
|
|
|
|
|
| IPAIR | NAME | SHIFT | NEWSHIFT | S/N | NAME | SHIFT | NEWSHIFT | S/N |
| 0 | 06650049 | 0.459243 | 0.00000 | 179.238 | 06650055 | 0.0384720 | 0.420771 | 180.681 |
| 1 | 06650053 | 0.449768 | 0.00947499 | 181.140 | 06650051 | 0.0406819 | 0.418561 | 185.666 |
| 2 | 06650054 | 0.450964 | 0.00827900 | 178.779 | 06650052 | 0.0418788 | 0.417364 | 177.843 |
| 3 | 06650050 | 0.457666 | 0.00157699 | 176.634 | 06650048 | 0.00000 | 0.459243 | 163.397 |