| Red | Green | Blue | |
| z | 17.64 | ||
| znorm | Inf | ||
| sky | -NaN | -NaN | -Inf |
| S/N | 26.3 | 45.4 | 49.2 |
| S/N(c) | 0.0 | 0.0 | 0.0 |
| SN(E/C) |

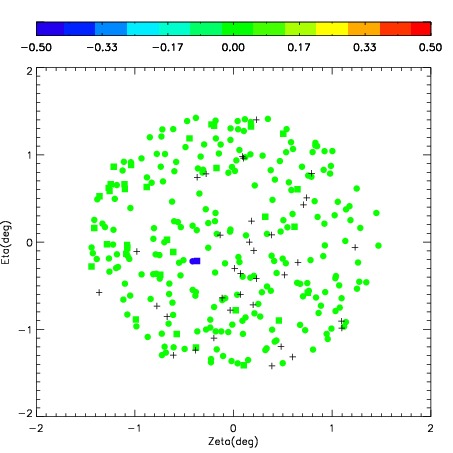
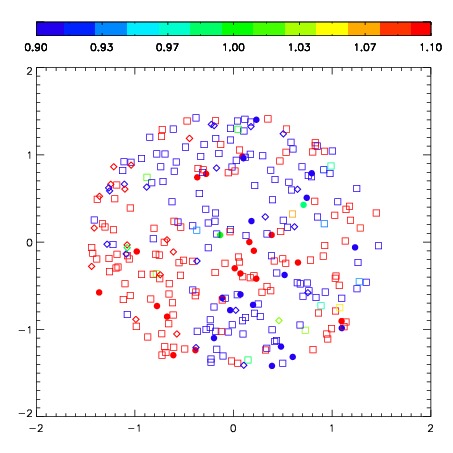
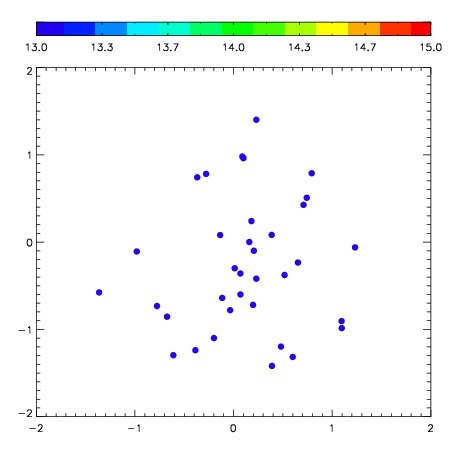
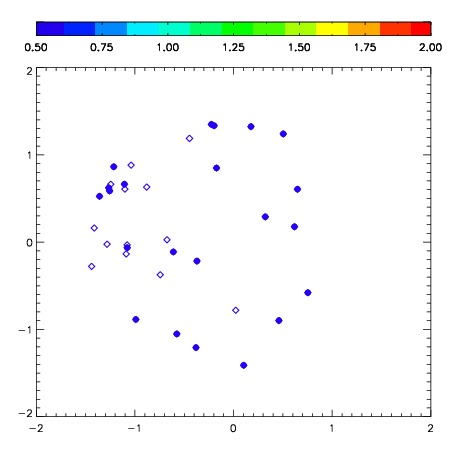
| Frame | Nreads | Zeropoints | Mag plots | Spatial mag deviation | Spatial sky 16325A emission deviations (filled: sky, open: star) | Spatial sky continuum emission | Spatial sky telluric CO2 absorption deviations (filled: H < 10) | |||||||||||||||||||||||
| 0 | 0 |
|
|
|
|
|
|
| IPAIR | NAME | SHIFT | NEWSHIFT | S/N | NAME | SHIFT | NEWSHIFT | S/N |
| 0 | 06690046 | 0.414934 | 0.00000 | 241.045 | 06690044 | 0.00917834 | 0.405756 | 243.411 |
| 1 | 06690042 | 0.411796 | 0.00313801 | 244.241 | 06690040 | 0.00000 | 0.414934 | 244.530 |
| 2 | 06690041 | 0.412833 | 0.00210100 | 239.819 | 06690043 | 0.00984029 | 0.405094 | 241.101 |
| 3 | 06690045 | 0.413027 | 0.00190702 | 234.242 | 06690047 | 0.0118245 | 0.403110 | 237.537 |