| Red | Green | Blue | |
| z | 17.64 | ||
| znorm | Inf | ||
| sky | -Inf | -Inf | -Inf |
| S/N | 26.5 | 44.9 | 47.9 |
| S/N(c) | 0.0 | 0.0 | 0.0 |
| SN(E/C) |

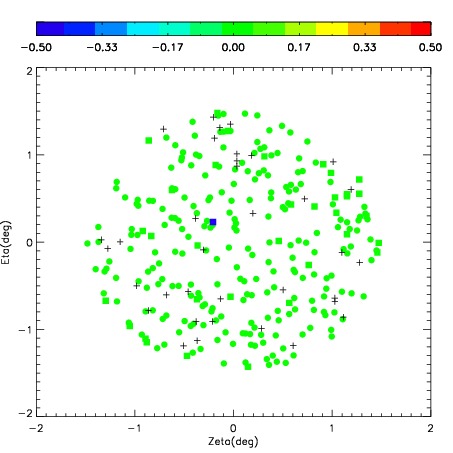

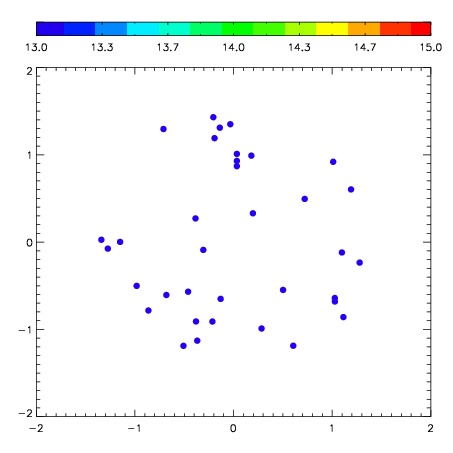
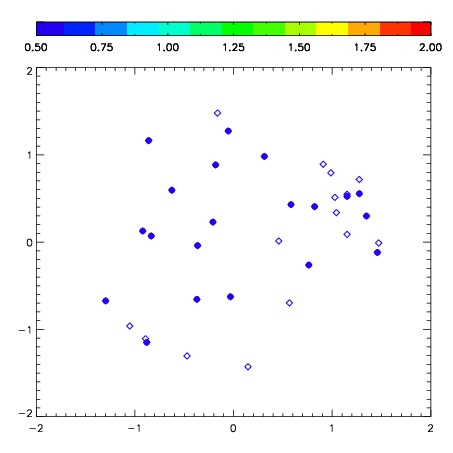
| Frame | Nreads | Zeropoints | Mag plots | Spatial mag deviation | Spatial sky 16325A emission deviations (filled: sky, open: star) | Spatial sky continuum emission | Spatial sky telluric CO2 absorption deviations (filled: H < 10) | |||||||||||||||||||||||
| 0 | 0 |
|
|
|
|
|
|
| IPAIR | NAME | SHIFT | NEWSHIFT | S/N | NAME | SHIFT | NEWSHIFT | S/N |
| 0 | 06920053 | 0.409855 | 0.00000 | 241.682 | 06920052 | 0.00000 | 0.409855 | 242.319 |
| 1 | 06920057 | 0.407085 | 0.00277001 | 263.558 | 06920059 | 0.000240803 | 0.409614 | 267.152 |
| 2 | 06920058 | 0.406246 | 0.00360900 | 260.608 | 06920056 | -0.00145741 | 0.411312 | 254.593 |
| 3 | 06920054 | 0.405090 | 0.00476500 | 253.819 | 06920055 | -0.000735998 | 0.410591 | 252.178 |