| Red | Green | Blue | |
| z | 17.64 | ||
| znorm | Inf | ||
| sky | -Inf | -Inf | -Inf |
| S/N | 18.4 | 30.1 | 34.3 |
| S/N(c) | 0.0 | 0.0 | 0.0 |
| SN(E/C) |

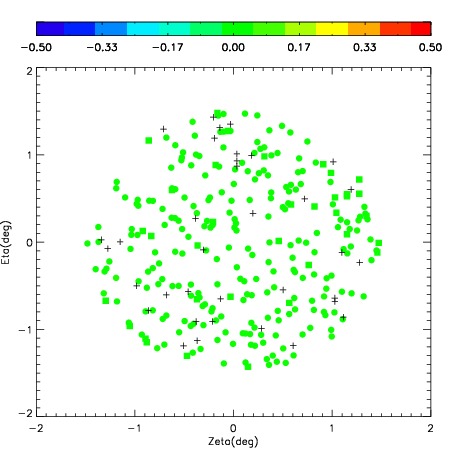

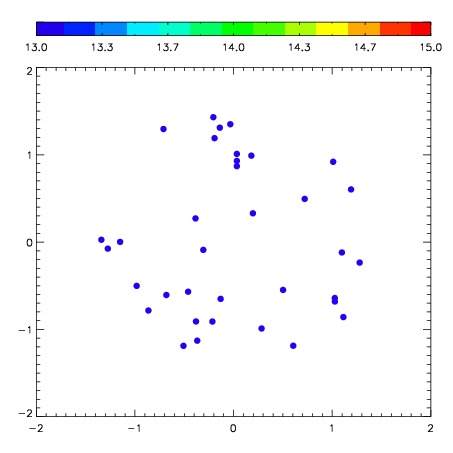
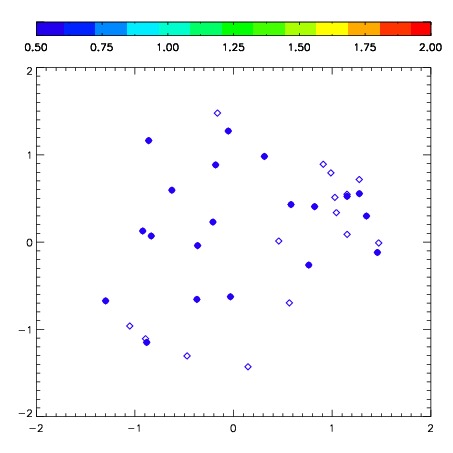
| Frame | Nreads | Zeropoints | Mag plots | Spatial mag deviation | Spatial sky 16325A emission deviations (filled: sky, open: star) | Spatial sky continuum emission | Spatial sky telluric CO2 absorption deviations (filled: H < 10) | |||||||||||||||||||||||
| 0 | 0 |
|
|
|
|
|
|
| IPAIR | NAME | SHIFT | NEWSHIFT | S/N | NAME | SHIFT | NEWSHIFT | S/N |
| 0 | 06980050 | 0.418750 | 0.00000 | 186.771 | 06980051 | 0.00749367 | 0.411256 | 163.092 |
| 1 | 06980054 | 0.407546 | 0.0112040 | 228.856 | 06980055 | 0.00771737 | 0.411033 | 260.096 |
| 2 | 06980053 | 0.412690 | 0.00605997 | 228.841 | 06980048 | 0.00000 | 0.418750 | 240.918 |
| 3 | 06980049 | 0.417140 | 0.00160998 | 195.287 | 06980052 | 0.00890267 | 0.409847 | 197.789 |