| Red | Green | Blue | |
| z | 17.64 | ||
| znorm | Inf | ||
| sky | -NaN | -NaN | -Inf |
| S/N | 21.5 | 32.0 | 35.8 |
| S/N(c) | 0.0 | 0.0 | 0.0 |
| SN(E/C) |
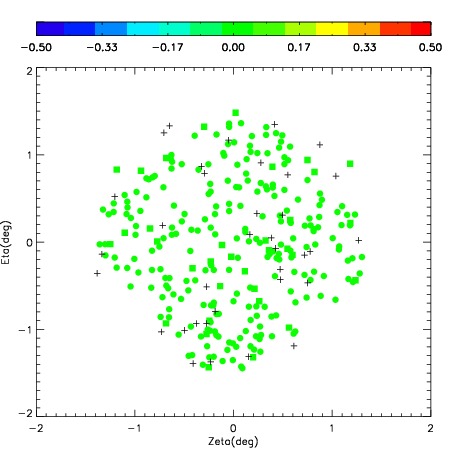
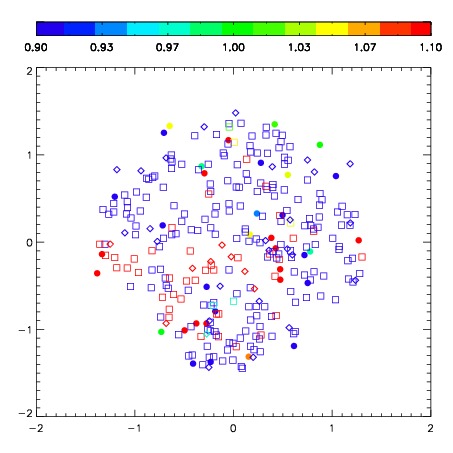
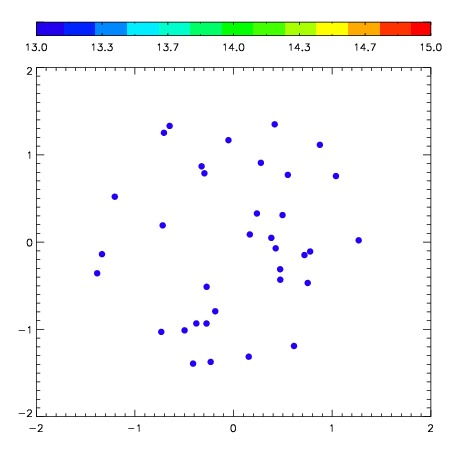
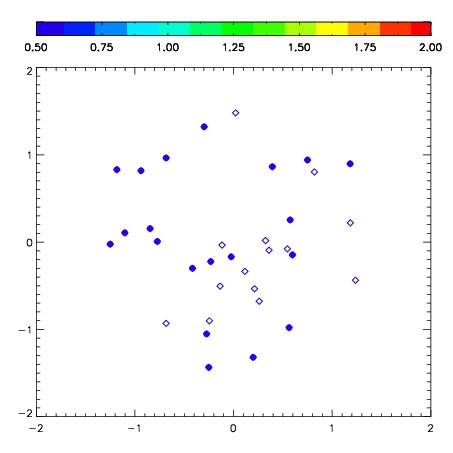
| Frame | Nreads | Zeropoints | Mag plots | Spatial mag deviation | Spatial sky 16325A emission deviations (filled: sky, open: star) | Spatial sky continuum emission | Spatial sky telluric CO2 absorption deviations (filled: H < 10) | |||||||||||||||||||||||
| 0 | 0 |
|
|
|
|
|
|
| IPAIR | NAME | SHIFT | NEWSHIFT | S/N | NAME | SHIFT | NEWSHIFT | S/N |
| 0 | 08760064 | 0.308835 | 0.00000 | 249.668 | 08760066 | 0.0193712 | 0.289464 | 254.976 |
| 1 | 08760065 | 0.305816 | 0.00301901 | 253.546 | 08760067 | 0.0166912 | 0.292144 | 258.940 |
| 2 | 08760069 | 0.287436 | 0.0213990 | 245.584 | 08760063 | 0.00000 | 0.308835 | 247.299 |
| 3 | 08760068 | 0.302355 | 0.00648001 | 240.187 | 08760070 | 0.0163556 | 0.292479 | 240.472 |