| Red | Green | Blue | |
| z | 17.64 | ||
| znorm | Inf | ||
| sky | -Inf | -Inf | -Inf |
| S/N | 33.8 | 52.9 | 53.4 |
| S/N(c) | 0.0 | 0.0 | 0.0 |
| SN(E/C) |

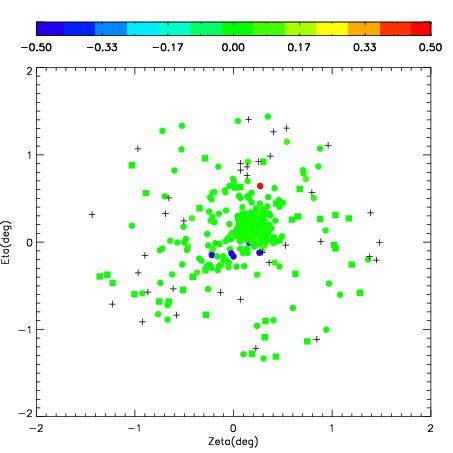

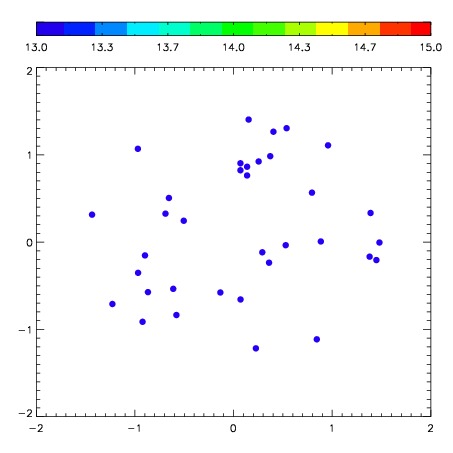
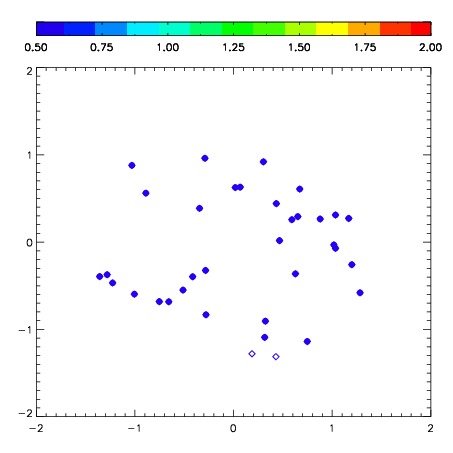
| Frame | Nreads | Zeropoints | Mag plots | Spatial mag deviation | Spatial sky 16325A emission deviations (filled: sky, open: star) | Spatial sky continuum emission | Spatial sky telluric CO2 absorption deviations (filled: H < 10) | |||||||||||||||||||||||
| 0 | 0 |
|
|
|
|
|
|
| IPAIR | NAME | SHIFT | NEWSHIFT | S/N | NAME | SHIFT | NEWSHIFT | S/N |
| 0 | 06100091 | 0.425741 | 0.00000 | 277.524 | 06100085 | 0.00000 | 0.425741 | 274.637 |
| 1 | 06100090 | 0.421598 | 0.00414300 | 279.540 | 06100089 | 0.00464107 | 0.421100 | 277.655 |
| 2 | 06100087 | 0.424134 | 0.00160700 | 277.563 | 06100088 | 0.00326928 | 0.422472 | 277.593 |
| 3 | 06100086 | 0.424906 | 0.000835001 | 275.698 | 06100092 | 0.00998458 | 0.415756 | 250.684 |