| Red | Green | Blue | |
| z | 17.64 | ||
| znorm | Inf | ||
| sky | -Inf | -Inf | -Inf |
| S/N | 38.6 | 60.6 | 59.6 |
| S/N(c) | 0.0 | 0.0 | 0.0 |
| SN(E/C) |

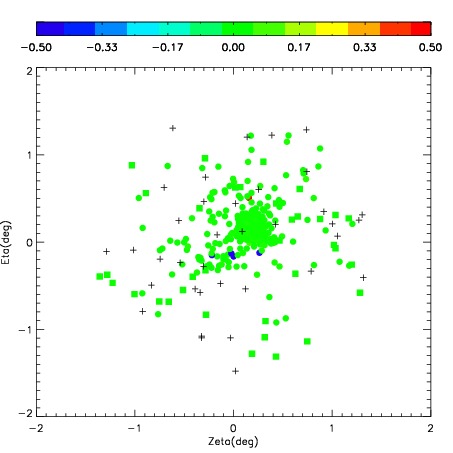

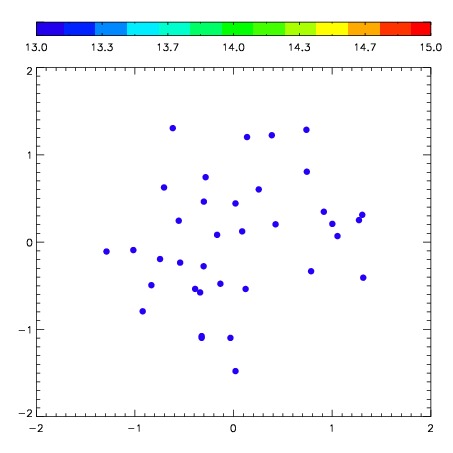
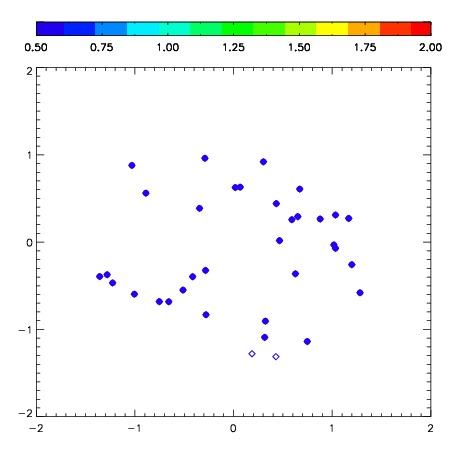
| Frame | Nreads | Zeropoints | Mag plots | Spatial mag deviation | Spatial sky 16325A emission deviations (filled: sky, open: star) | Spatial sky continuum emission | Spatial sky telluric CO2 absorption deviations (filled: H < 10) | |||||||||||||||||||||||
| 0 | 0 |
|
|
|
|
|
|
| IPAIR | NAME | SHIFT | NEWSHIFT | S/N | NAME | SHIFT | NEWSHIFT | S/N |
| 0 | 07000046 | 0.608691 | 0.00000 | 238.629 | 07000045 | 0.0996591 | 0.509032 | 243.677 |
| 1 | 07000038 | 0.597426 | 0.0112650 | 237.541 | 07000044 | 0.115354 | 0.493337 | 232.728 |
| 2 | 07000039 | 0.599467 | 0.00922400 | 230.466 | 07000041 | 0.125556 | 0.483135 | 227.477 |
| 3 | 07000043 | 0.602821 | 0.00586998 | 228.088 | 07000040 | 0.119652 | 0.489039 | 226.651 |
| 4 | 07000042 | 0.596312 | 0.0123790 | 226.873 | 07000037 | 0.00000 | 0.608691 | 221.342 |