| Red | Green | Blue | |
| z | 17.64 | ||
| znorm | Inf | ||
| sky | -Inf | -Inf | -Inf |
| S/N | 30.5 | 48.3 | 54.4 |
| S/N(c) | 0.0 | 0.0 | 0.0 |
| SN(E/C) |
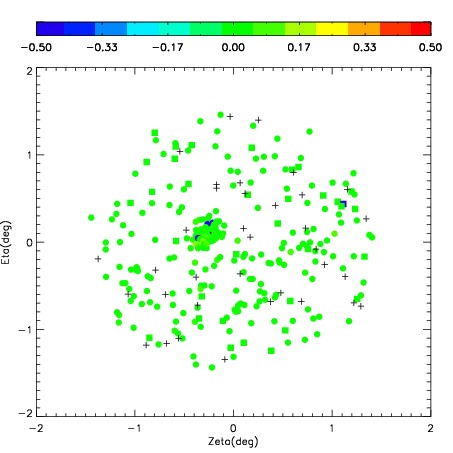
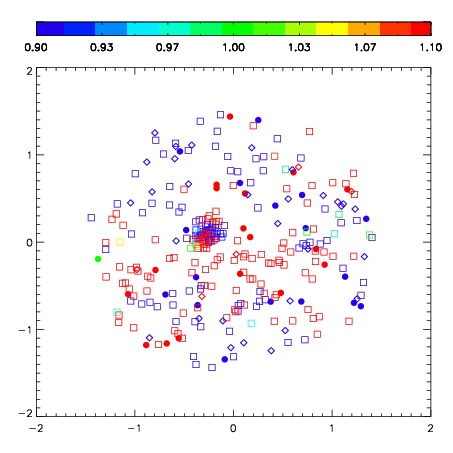


| Frame | Nreads | Zeropoints | Mag plots | Spatial mag deviation | Spatial sky 16325A emission deviations (filled: sky, open: star) | Spatial sky continuum emission | Spatial sky telluric CO2 absorption deviations (filled: H < 10) | |||||||||||||||||||||||
| 0 | 0 |
|
|
|
|
|
|
| IPAIR | NAME | SHIFT | NEWSHIFT | S/N | NAME | SHIFT | NEWSHIFT | S/N |
| 0 | 07530028 | 0.360975 | 0.00000 | 268.724 | 07530033 | -0.0137595 | 0.374734 | 271.504 |
| 1 | 07530027 | 0.349082 | 0.0118930 | 281.413 | 07530030 | -0.00897307 | 0.369948 | 280.854 |
| 2 | 07530031 | 0.359083 | 0.00189200 | 277.961 | 07530029 | -0.0139938 | 0.374969 | 277.858 |
| 3 | 07530032 | 0.358425 | 0.00255001 | 277.199 | 07530026 | 0.00000 | 0.360975 | 275.139 |
| 4 | 07530035 | 0.360522 | 0.000452995 | 272.566 | 07530034 | -0.0159067 | 0.376882 | 272.495 |