| Red | Green | Blue | |
| z | 17.64 | ||
| znorm | Inf | ||
| sky | -NaN | -Inf | -Inf |
| S/N | 25.2 | 41.4 | 44.1 |
| S/N(c) | 0.0 | 0.0 | 0.0 |
| SN(E/C) |

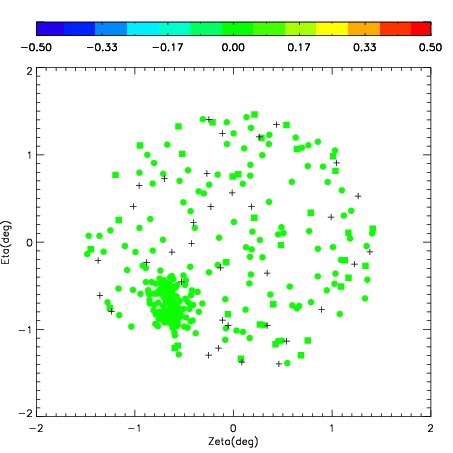

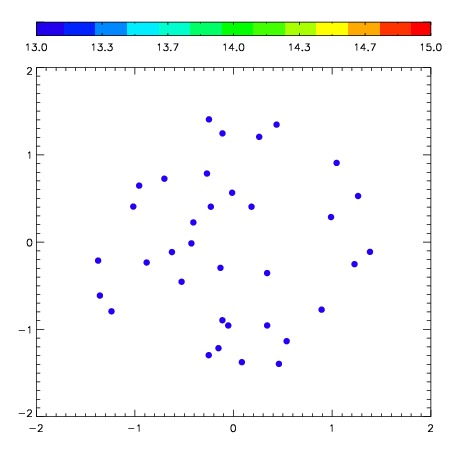
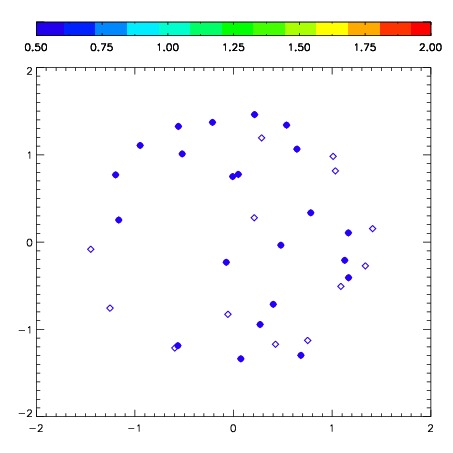
| Frame | Nreads | Zeropoints | Mag plots | Spatial mag deviation | Spatial sky 16325A emission deviations (filled: sky, open: star) | Spatial sky continuum emission | Spatial sky telluric CO2 absorption deviations (filled: H < 10) | |||||||||||||||||||||||
| 0 | 0 |
|
|
|
|
|
|
| IPAIR | NAME | SHIFT | NEWSHIFT | S/N | NAME | SHIFT | NEWSHIFT | S/N |
| 0 | 07610012 | 0.370172 | 0.00000 | 286.465 | 07610014 | 0.0112799 | 0.358892 | 282.123 |
| 1 | 07610013 | 0.362892 | 0.00727999 | 285.412 | 07610011 | 0.00000 | 0.370172 | 277.838 |
| 2 | 07610017 | 0.365007 | 0.00516498 | 270.927 | 07610018 | 0.00959080 | 0.360581 | 276.345 |
| 3 | 07610016 | 0.361718 | 0.00845399 | 267.477 | 07610015 | 0.0128585 | 0.357313 | 276.046 |