| Red | Green | Blue | |
| z | 17.64 | ||
| znorm | Inf | ||
| sky | -Inf | -Inf | -Inf |
| S/N | 32.8 | 56.2 | 58.9 |
| S/N(c) | 0.0 | 0.0 | 0.0 |
| SN(E/C) |
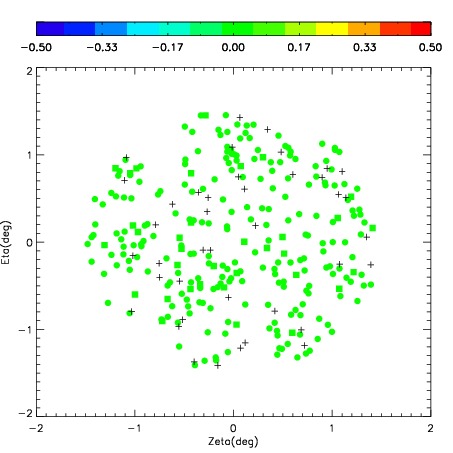
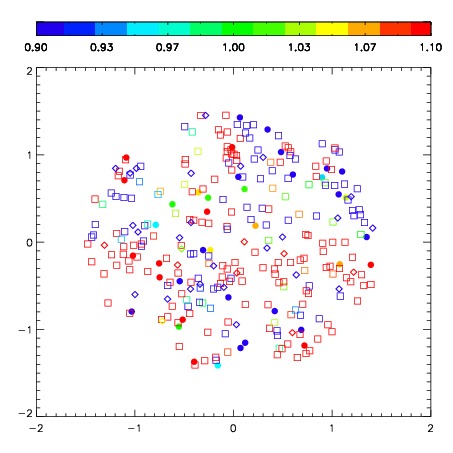
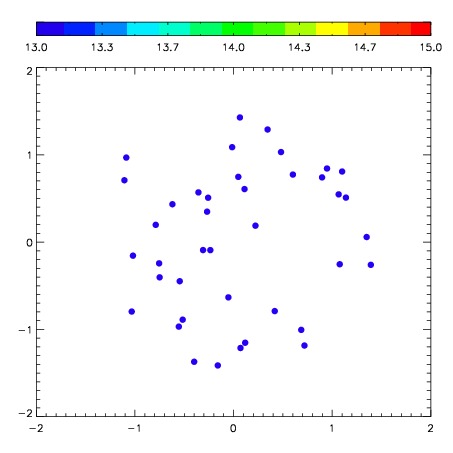

| Frame | Nreads | Zeropoints | Mag plots | Spatial mag deviation | Spatial sky 16325A emission deviations (filled: sky, open: star) | Spatial sky continuum emission | Spatial sky telluric CO2 absorption deviations (filled: H < 10) | |||||||||||||||||||||||
| 0 | 0 |
|
|
|
|
|
|
| IPAIR | NAME | SHIFT | NEWSHIFT | S/N | NAME | SHIFT | NEWSHIFT | S/N |
| 0 | 06410044 | 0.540264 | 0.00000 | 247.966 | 06410042 | 0.00000 | 0.540264 | 248.247 |
| 1 | 06410051 | 0.539586 | 0.000678003 | 268.567 | 06410053 | 0.0553343 | 0.484930 | 279.723 |
| 2 | 06410052 | 0.528547 | 0.0117170 | 266.959 | 06410050 | 0.0549721 | 0.485292 | 255.288 |
| 3 | 06410043 | 0.529535 | 0.0107290 | 247.594 | 06410045 | 0.0553035 | 0.484960 | 243.134 |
| 4 | 06410047 | 0.536761 | 0.00350302 | 246.381 | 06410049 | 0.0552653 | 0.484999 | 241.037 |
| 5 | 06410048 | 0.536470 | 0.00379401 | 222.513 | 06410046 | 0.0586557 | 0.481608 | 237.635 |