| Red | Green | Blue | |
| z | 17.64 | ||
| znorm | Inf | ||
| sky | -Inf | -Inf | -Inf |
| S/N | 34.8 | 55.4 | 59.1 |
| S/N(c) | 0.0 | 0.0 | 0.0 |
| SN(E/C) |
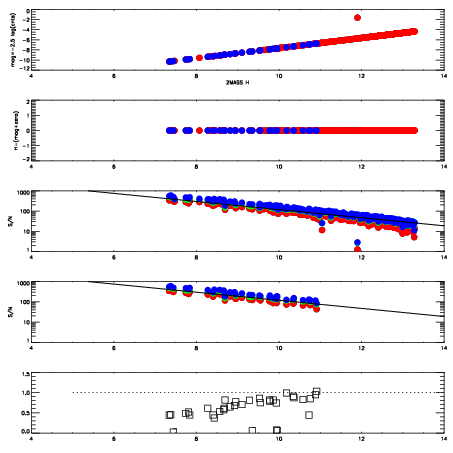

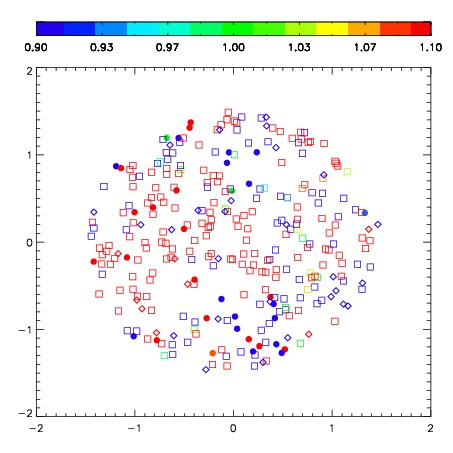
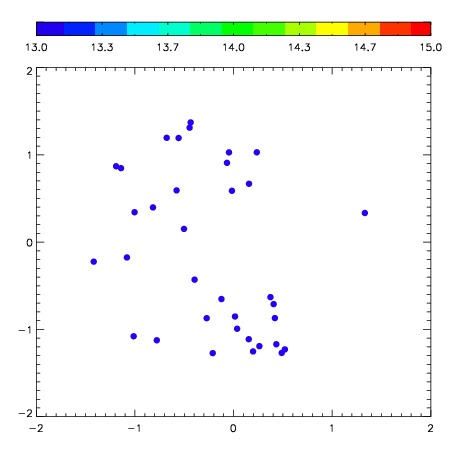
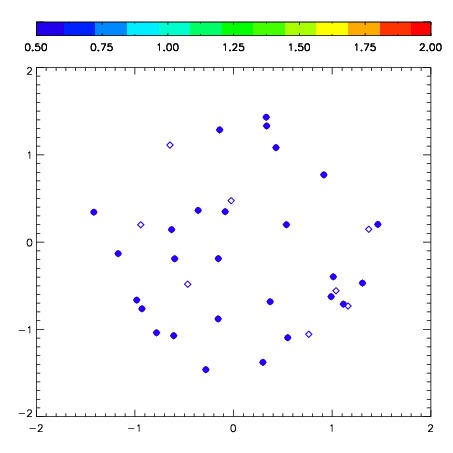
| Frame | Nreads | Zeropoints | Mag plots | Spatial mag deviation | Spatial sky 16325A emission deviations (filled: sky, open: star) | Spatial sky continuum emission | Spatial sky telluric CO2 absorption deviations (filled: H < 10) | |||||||||||||||||||||||
| 0 | 0 |
|
|
|
|
|
|
| IPAIR | NAME | SHIFT | NEWSHIFT | S/N | NAME | SHIFT | NEWSHIFT | S/N |
| 0 | 06130017 | 0.494374 | 0.00000 | 241.789 | 06130018 | 0.0415940 | 0.452780 | 240.975 |
| 1 | 06130013 | 0.488661 | 0.00571302 | 256.772 | 06130014 | 0.0437834 | 0.450591 | 255.416 |
| 2 | 06130012 | 0.487884 | 0.00648999 | 253.073 | 06130015 | 0.0412290 | 0.453145 | 247.350 |
| 3 | 06130016 | 0.492603 | 0.00177100 | 245.754 | 06130011 | 0.00000 | 0.494374 | 247.295 |