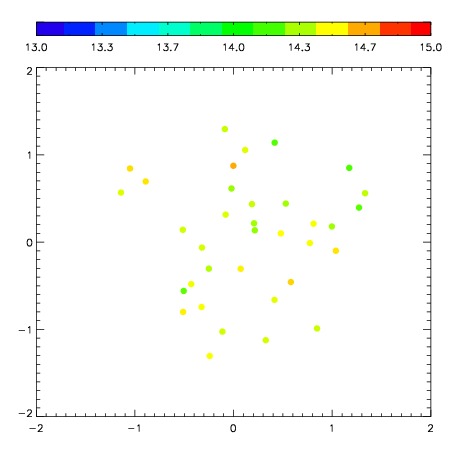
| Frame | Nreads | Zeropoints | Mag plots
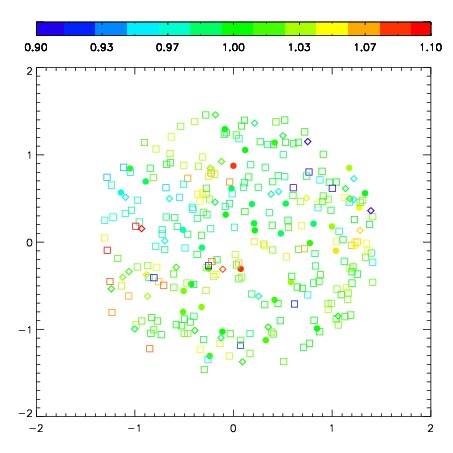
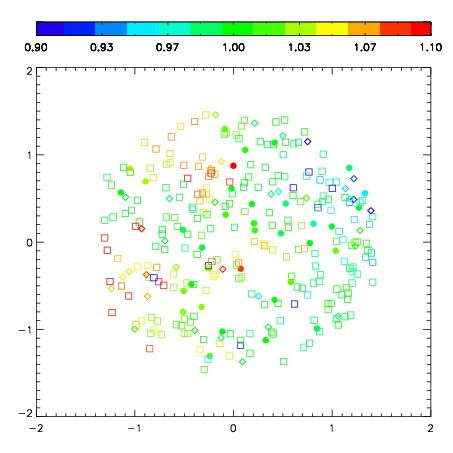
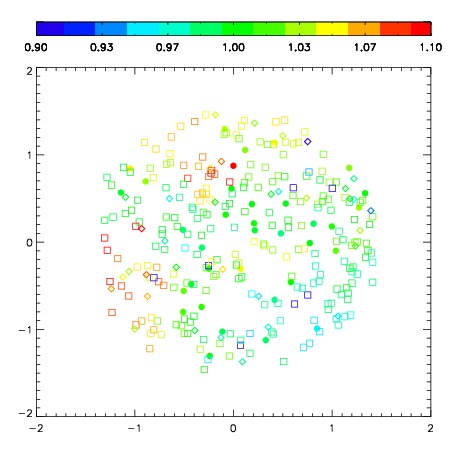
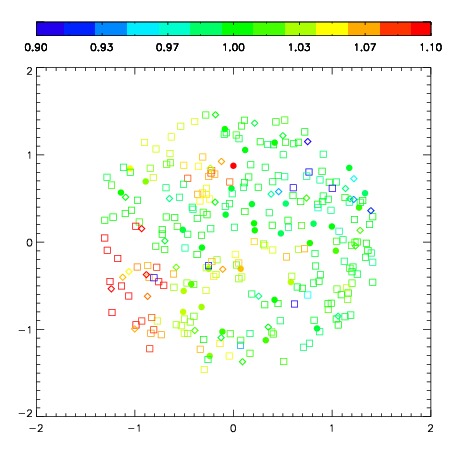
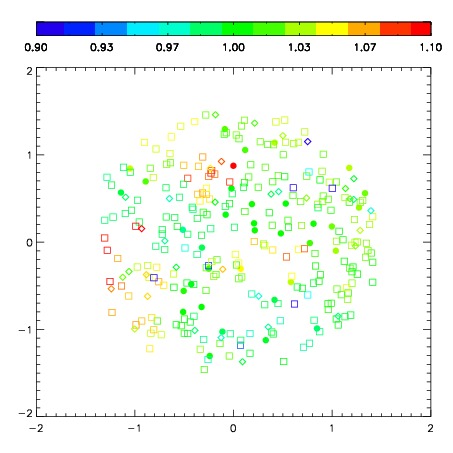
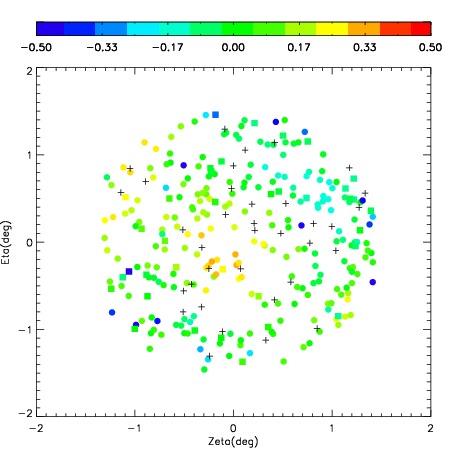
| Spatial mag deviation
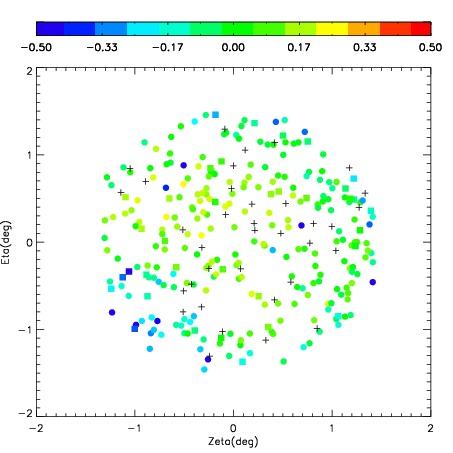
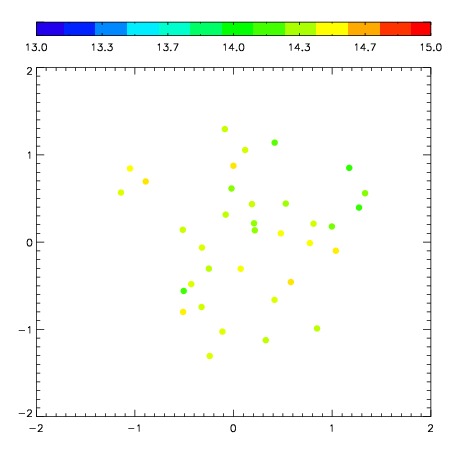
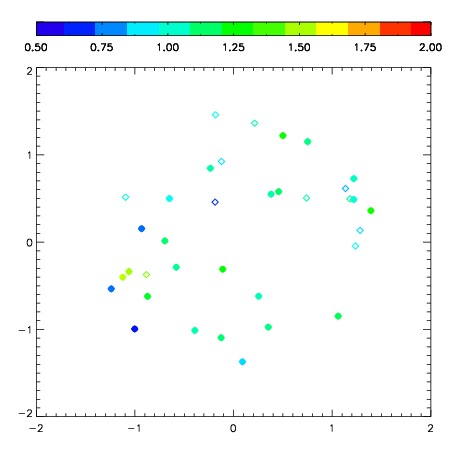
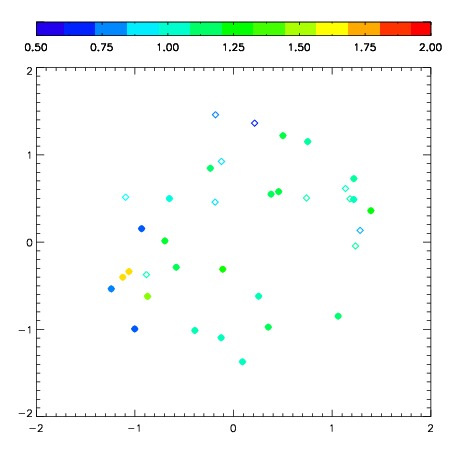
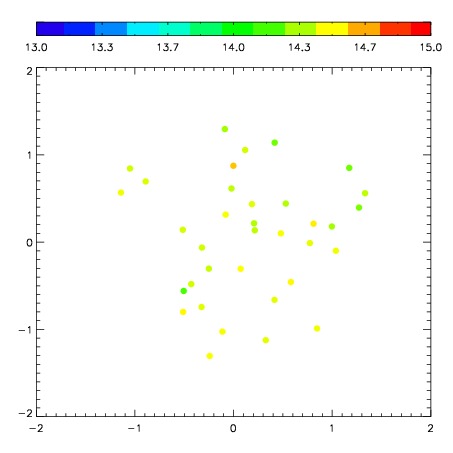
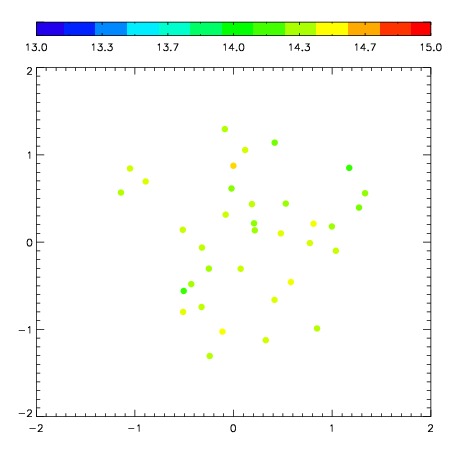
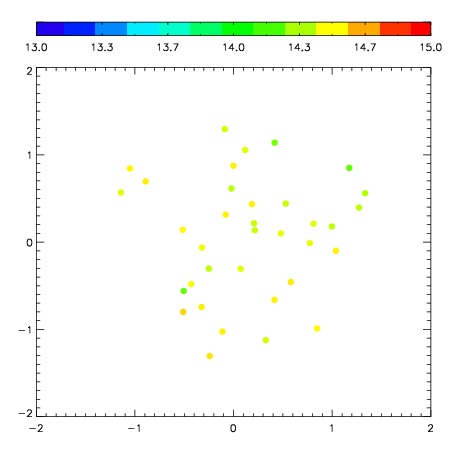
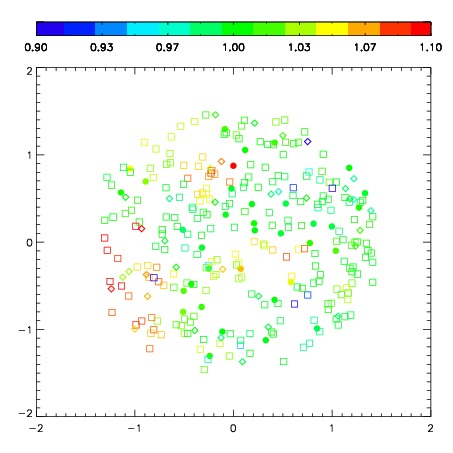
| Spatial sky 16325A emission deviations (filled: sky, open: star)
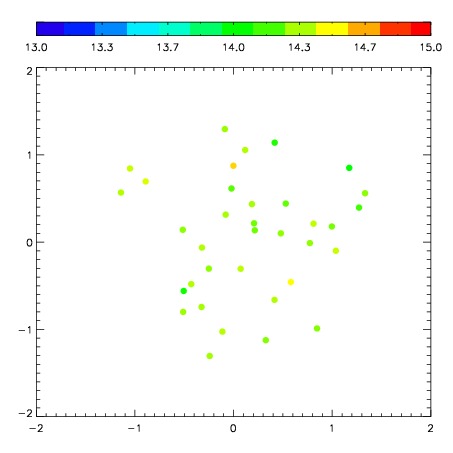
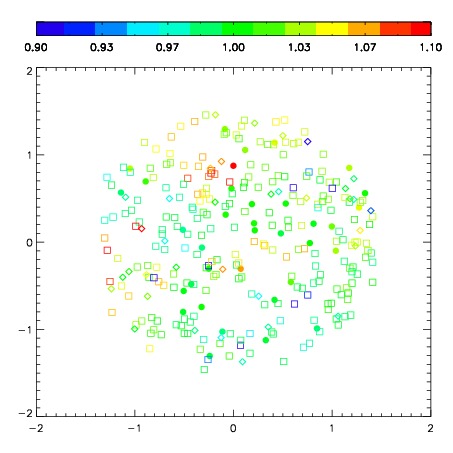
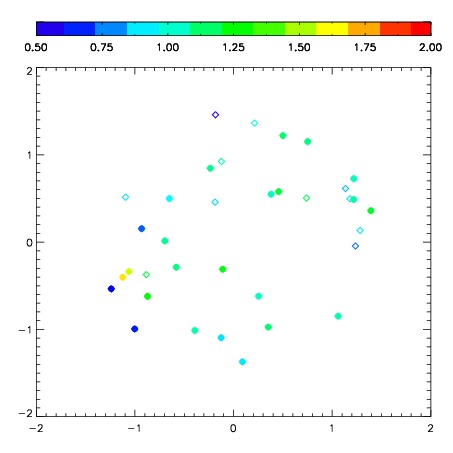
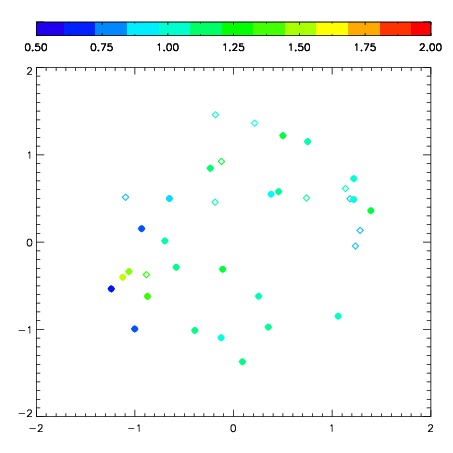
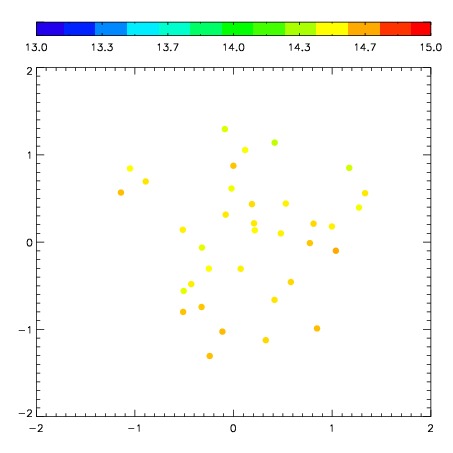
| Spatial sky continuum emission
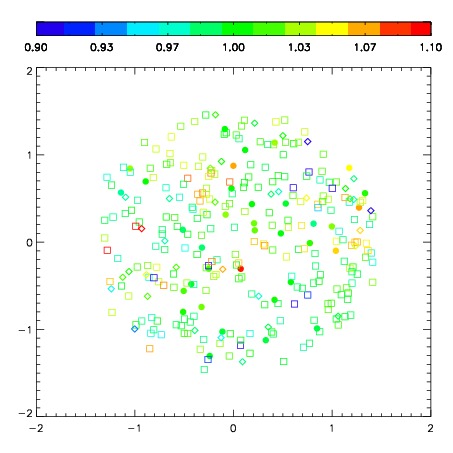
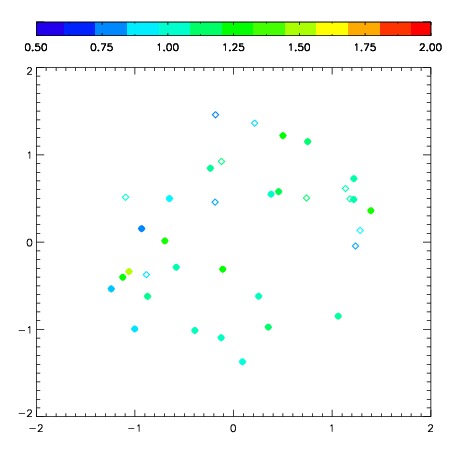
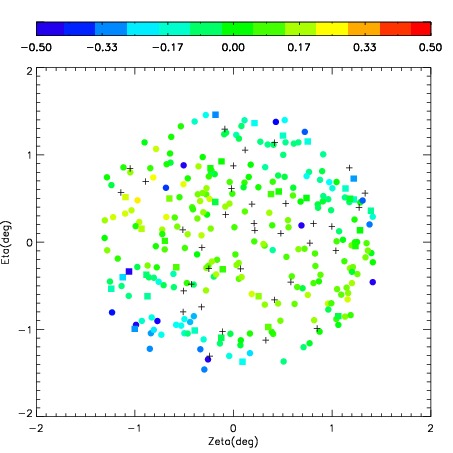
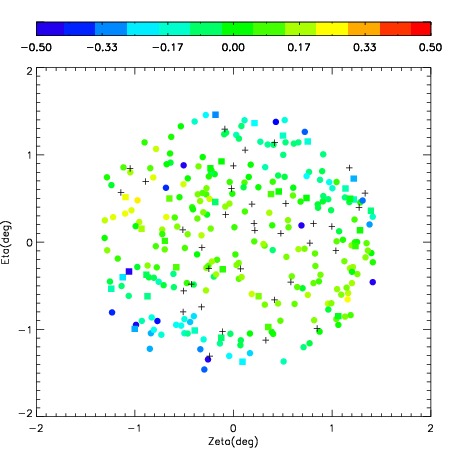
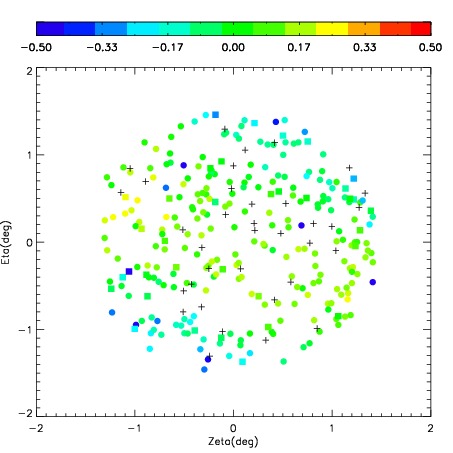
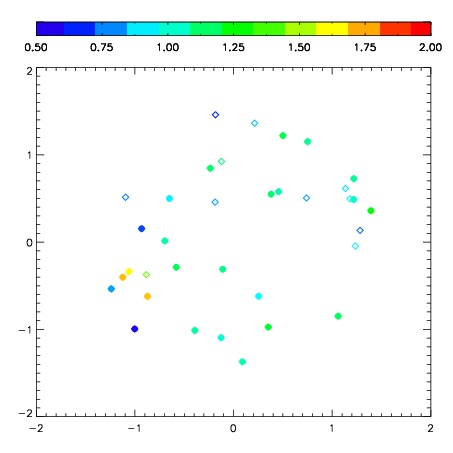
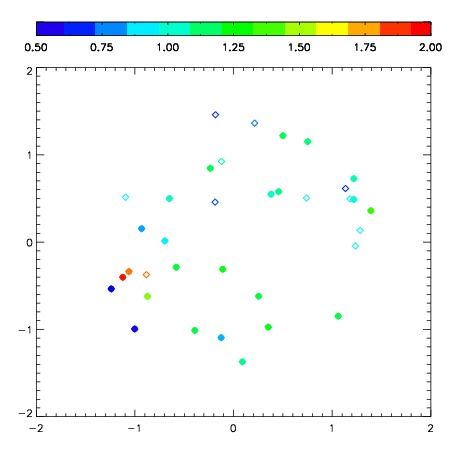
| Spatial sky telluric CO2 absorption deviations (filled: H < 10)
|
| 6960011
| 47
| | Red | Green | Blue
| | z | | 18.84
| | znorm | | 14.66
| | sky | 14.6 | 14.2 | 14.1
| | S/N | 13.7 | 22.5 | 22.8
| | S/N(c) | 11.9 | 20.6 | 20.8
| | SN(E/C) 0.91
|
| 
| 
| 
| 
| 
|
| 6960012
| 47
| | Red | Green | Blue
| | z | | 18.86
| | znorm | | 14.68
| | sky | 14.4 | 14.3 | 14.4
| | S/N | 13.1 | 22.1 | 22.5
| | S/N(c) | 11.6 | 19.8 | 20.9
| | SN(E/C) 0.88
|
| 
| 
| 
| 
| 
|
| 6960013
| 47
| | Red | Green | Blue
| | z | | 18.80
| | znorm | | 14.62
| | sky | 14.6 | 14.3 | 14.4
| | S/N | 13.1 | 21.6 | 21.9
| | S/N(c) | 11.2 | 19.8 | 20.2
| | SN(E/C) 0.92
|
| 
| 
| 
| 
| 
|
| 6960014
| 47
| | Red | Green | Blue
| | z | | 18.83
| | znorm | | 14.65
| | sky | 14.6 | 14.4 | 14.5
| | S/N | 13.0 | 21.7 | 22.1
| | S/N(c) | 11.3 | 19.9 | 20.6
| | SN(E/C) 0.94
|
| 
| 
| 
| 
| 
|
| 6960015
| 47
| | Red | Green | Blue
| | z | | 18.75
| | znorm | | 14.57
| | sky | 14.4 | 14.4 | 14.4
| | S/N | 12.3 | 21.0 | 21.0
| | S/N(c) | 10.7 | 19.1 | 19.7
| | SN(E/C) 0.97
|
| 
| 
| 
| 
| 
|
| 6960016
| 47
| | Red | Green | Blue
| | z | | 18.72
| | znorm | | 14.54
| | sky | 14.6 | 14.3 | 14.3
| | S/N | 12.3 | 20.8 | 21.0
| | S/N(c) | 10.5 | 19.0 | 19.4
| | SN(E/C) 0.93
|
| 
| 
| 
| 
| 
|
| 6960017
| 47
| | Red | Green | Blue
| | z | | 18.52
| | znorm | | 14.34
| | sky | 14.5 | 14.4 | 14.5
| | S/N | 10.7 | 18.5 | 19.2
| | S/N(c) | 9.3 | 16.7 | 17.7
| | SN(E/C) 0.97
|
| 
| 
| 
| 
| 
|
| 6960018
| 47
| | Red | Green | Blue
| | z | | 18.00
| | znorm | | 13.82
| | sky | 14.7 | 14.5 | 14.5
| | S/N | 7.2 | 13.2 | 14.1
| | S/N(c) | 6.2 | 11.8 | 13.0
| | SN(E/C) 1.01
|
| 
| 
| 
| 
| 
|

