| Red | Green | Blue | |
| z | 17.64 | ||
| znorm | Inf | ||
| sky | -NaN | -Inf | -Inf |
| S/N | 20.9 | 36.9 | 37.8 |
| S/N(c) | 0.0 | 0.0 | 0.0 |
| SN(E/C) |


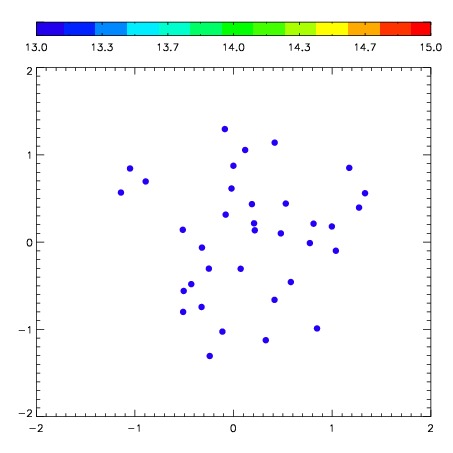
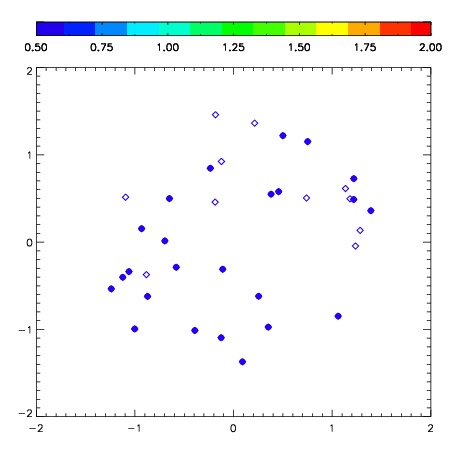
| Frame | Nreads | Zeropoints | Mag plots | Spatial mag deviation | Spatial sky 16325A emission deviations (filled: sky, open: star) | Spatial sky continuum emission | Spatial sky telluric CO2 absorption deviations (filled: H < 10) | |||||||||||||||||||||||
| 0 | 0 |
|
|
|
|
|
|
| IPAIR | NAME | SHIFT | NEWSHIFT | S/N | NAME | SHIFT | NEWSHIFT | S/N |
| 0 | 06960017 | 0.552598 | 0.00000 | 209.810 | 06960018 | 0.0510292 | 0.501569 | 172.984 |
| 1 | 06960012 | 0.544930 | 0.00766802 | 252.547 | 06960011 | 0.00000 | 0.552598 | 254.103 |
| 2 | 06960013 | 0.545300 | 0.00729799 | 242.428 | 06960014 | 0.0465454 | 0.506053 | 239.504 |
| 3 | 06960016 | 0.545160 | 0.00743800 | 229.433 | 06960015 | 0.0472153 | 0.505383 | 231.327 |