| Red | Green | Blue | |
| z | 17.64 | ||
| znorm | Inf | ||
| sky | -Inf | -NaN | -Inf |
| S/N | 25.6 | 43.1 | 45.8 |
| S/N(c) | 0.0 | 0.0 | 0.0 |
| SN(E/C) |

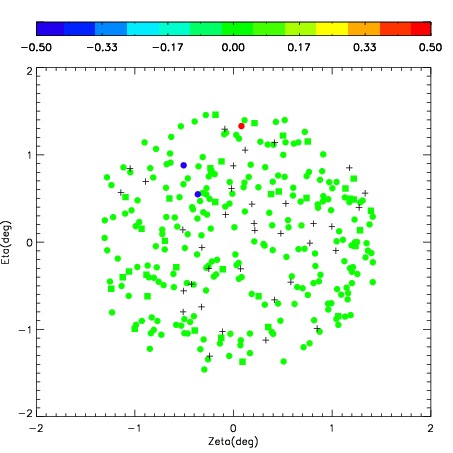
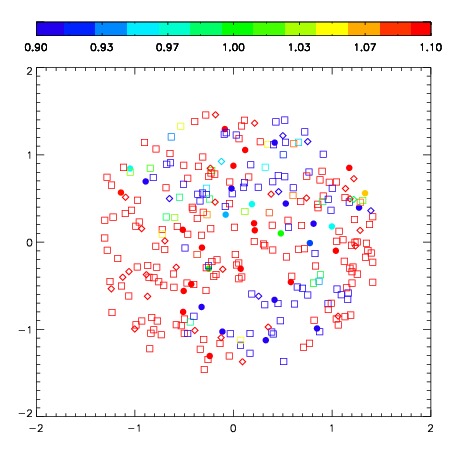
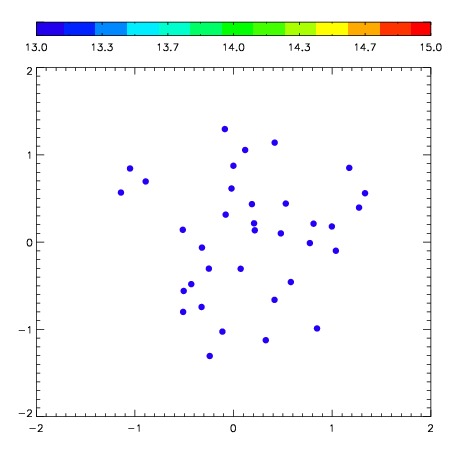

| Frame | Nreads | Zeropoints | Mag plots | Spatial mag deviation | Spatial sky 16325A emission deviations (filled: sky, open: star) | Spatial sky continuum emission | Spatial sky telluric CO2 absorption deviations (filled: H < 10) | |||||||||||||||||||||||
| 0 | 0 |
|
|
|
|
|
|
| IPAIR | NAME | SHIFT | NEWSHIFT | S/N | NAME | SHIFT | NEWSHIFT | S/N |
| 0 | 07000017 | 0.432526 | 0.00000 | 250.402 | 07000018 | 0.0129028 | 0.419623 | 253.661 |
| 1 | 07000012 | 0.428474 | 0.00405198 | 249.092 | 07000015 | 0.0109331 | 0.421593 | 252.452 |
| 2 | 07000013 | 0.430997 | 0.00152898 | 247.298 | 07000011 | 0.00000 | 0.432526 | 251.123 |
| 3 | 07000016 | 0.429681 | 0.00284499 | 246.762 | 07000014 | 0.0115387 | 0.420987 | 247.821 |