| Red | Green | Blue | |
| z | 17.64 | ||
| znorm | Inf | ||
| sky | -Inf | -NaN | -Inf |
| S/N | 27.3 | 47.1 | 51.2 |
| S/N(c) | 0.0 | 0.0 | 0.0 |
| SN(E/C) |
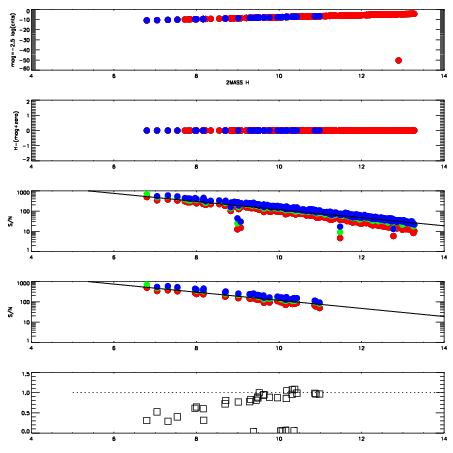

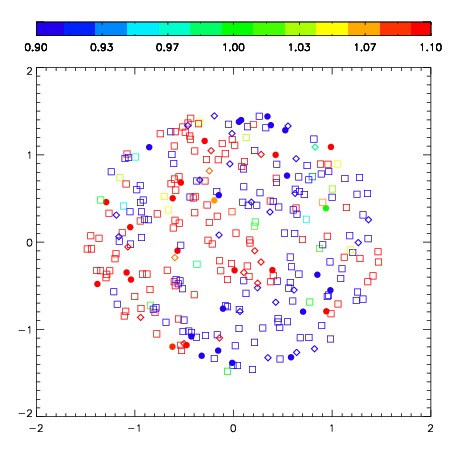


| Frame | Nreads | Zeropoints | Mag plots | Spatial mag deviation | Spatial sky 16325A emission deviations (filled: sky, open: star) | Spatial sky continuum emission | Spatial sky telluric CO2 absorption deviations (filled: H < 10) | |||||||||||||||||||||||
| 0 | 0 |
|
|
|
|
|
|
| IPAIR | NAME | SHIFT | NEWSHIFT | S/N | NAME | SHIFT | NEWSHIFT | S/N |
| 0 | 06440031 | 0.566303 | 0.00000 | 247.105 | 06440030 | 0.104122 | 0.462181 | 244.548 |
| 1 | 06440032 | 0.557477 | 0.00882602 | 249.491 | 06440033 | 0.125255 | 0.441048 | 256.396 |
| 2 | 06440027 | 0.565151 | 0.00115204 | 245.759 | 06440026 | 0.00000 | 0.566303 | 240.892 |
| 3 | 06440028 | 0.552469 | 0.0138340 | 242.124 | 06440029 | 0.103932 | 0.462371 | 239.430 |