| Red | Green | Blue | |
| z | 17.64 | ||
| znorm | Inf | ||
| sky | -NaN | -Inf | -Inf |
| S/N | 31.1 | 48.1 | 57.2 |
| S/N(c) | 0.0 | 0.0 | 0.0 |
| SN(E/C) |

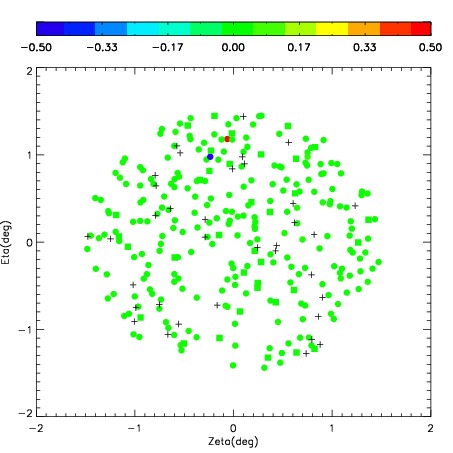

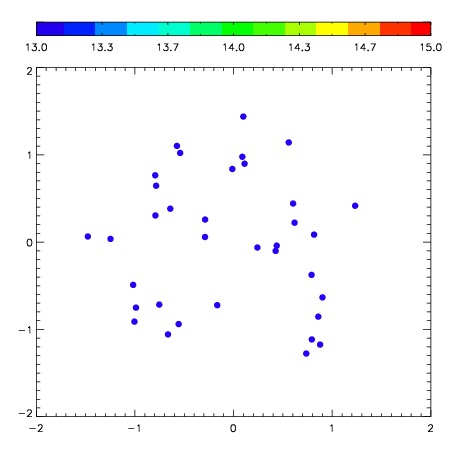
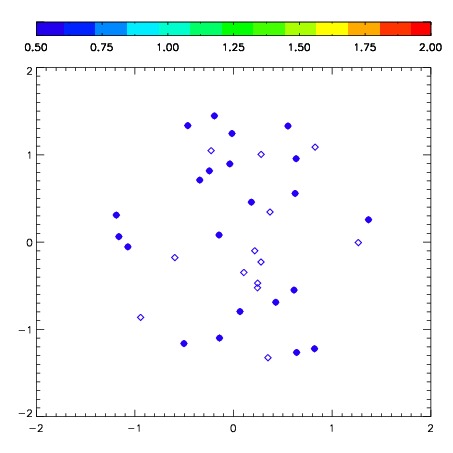
| Frame | Nreads | Zeropoints | Mag plots | Spatial mag deviation | Spatial sky 16325A emission deviations (filled: sky, open: star) | Spatial sky continuum emission | Spatial sky telluric CO2 absorption deviations (filled: H < 10) | |||||||||||||||||||||||
| 0 | 0 |
|
|
|
|
|
|
| IPAIR | NAME | SHIFT | NEWSHIFT | S/N | NAME | SHIFT | NEWSHIFT | S/N |
| 0 | 06640052 | 0.440293 | 0.00000 | 231.999 | 06640050 | 0.0376695 | 0.402624 | 225.779 |
| 1 | 06640048 | 0.427181 | 0.0131120 | 234.396 | 06640047 | 0.00000 | 0.440293 | 234.937 |
| 2 | 06640053 | 0.439362 | 0.000931025 | 233.402 | 06640054 | 0.0365320 | 0.403761 | 228.475 |
| 3 | 06640049 | 0.435331 | 0.00496203 | 229.341 | 06640051 | 0.0343960 | 0.405897 | 225.487 |