| Red | Green | Blue | |
| z | 17.64 | ||
| znorm | Inf | ||
| sky | -NaN | -Inf | -Inf |
| S/N | 26.0 | 41.9 | 46.6 |
| S/N(c) | 0.0 | 0.0 | 0.0 |
| SN(E/C) |

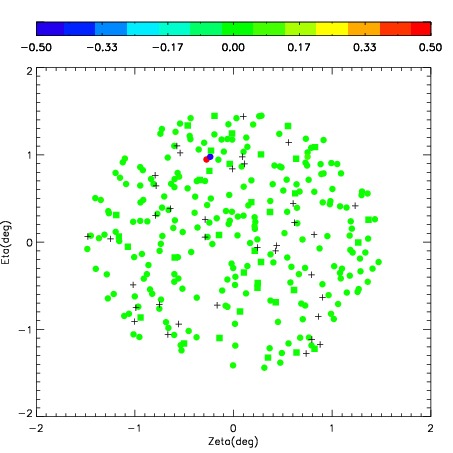
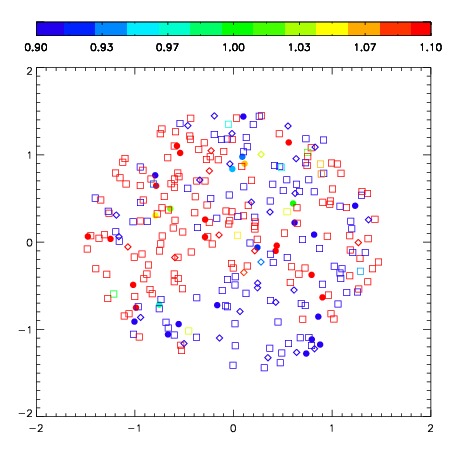
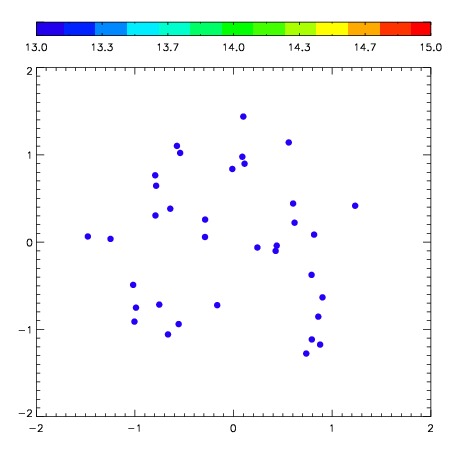
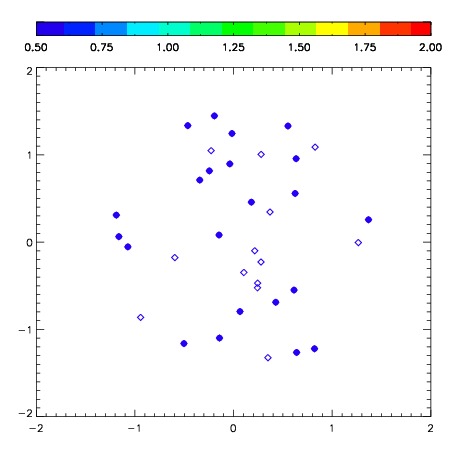
| Frame | Nreads | Zeropoints | Mag plots | Spatial mag deviation | Spatial sky 16325A emission deviations (filled: sky, open: star) | Spatial sky continuum emission | Spatial sky telluric CO2 absorption deviations (filled: H < 10) | |||||||||||||||||||||||
| 0 | 0 |
|
|
|
|
|
|
| IPAIR | NAME | SHIFT | NEWSHIFT | S/N | NAME | SHIFT | NEWSHIFT | S/N |
| 0 | 06680049 | 0.265813 | 0.00000 | 247.902 | 06680050 | -0.0743032 | 0.340116 | 255.737 |
| 1 | 06680048 | 0.255229 | 0.0105840 | 280.136 | 06680046 | -0.0694400 | 0.335253 | 291.843 |
| 2 | 06680045 | 0.259519 | 0.00629398 | 277.640 | 06680047 | -0.0627761 | 0.328589 | 286.656 |
| 3 | 06680044 | 0.257503 | 0.00830999 | 273.781 | 06680043 | 0.00000 | 0.265813 | 277.097 |