| Red | Green | Blue | |
| z | 17.64 | ||
| znorm | Inf | ||
| sky | -NaN | -NaN | -Inf |
| S/N | 23.5 | 39.9 | 43.4 |
| S/N(c) | 0.0 | 0.0 | 0.0 |
| SN(E/C) |
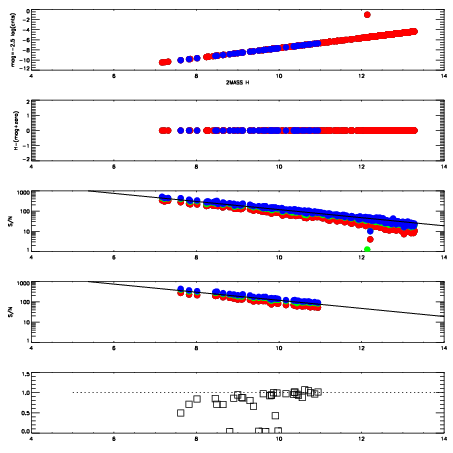


| Frame | Nreads | Zeropoints | Mag plots | Spatial mag deviation | Spatial sky 16325A emission deviations (filled: sky, open: star) | Spatial sky continuum emission | Spatial sky telluric CO2 absorption deviations (filled: H < 10) | |||||||||||||||||||||||
| 0 | 0 |
|
|
|
|
|
|
| IPAIR | NAME | SHIFT | NEWSHIFT | S/N | NAME | SHIFT | NEWSHIFT | S/N |
| 0 | 06090074 | 0.434292 | 0.00000 | 218.339 | 06090073 | 0.00000 | 0.434292 | 219.521 |
| 1 | 06090079 | 0.425255 | 0.00903699 | 260.748 | 06090080 | 0.0439201 | 0.390372 | 244.262 |
| 2 | 06090078 | 0.428114 | 0.00617799 | 257.517 | 06090077 | 0.0451796 | 0.389112 | 241.098 |
| 3 | 06090075 | 0.433656 | 0.000635982 | 233.505 | 06090076 | 0.0408644 | 0.393428 | 236.520 |