| Red | Green | Blue | |
| z | 17.64 | ||
| znorm | Inf | ||
| sky | -Inf | -Inf | -Inf |
| S/N | 28.9 | 48.0 | 51.5 |
| S/N(c) | 0.0 | 0.0 | 0.0 |
| SN(E/C) |

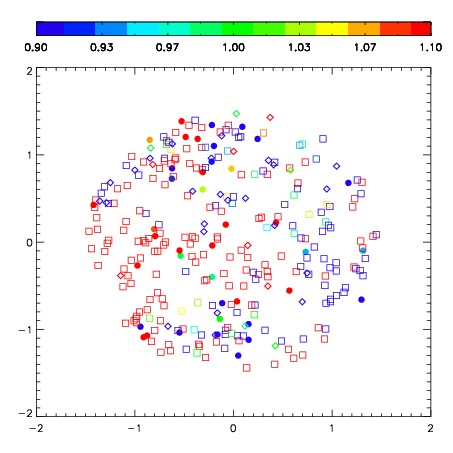

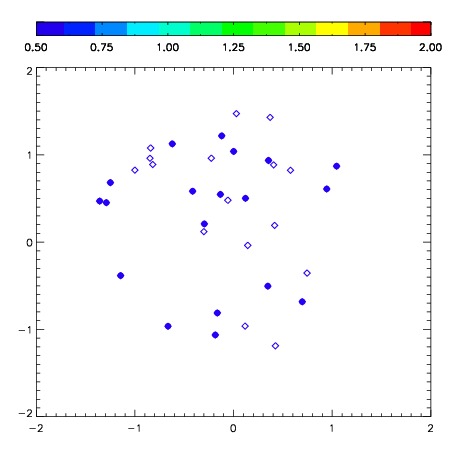
| Frame | Nreads | Zeropoints | Mag plots | Spatial mag deviation | Spatial sky 16325A emission deviations (filled: sky, open: star) | Spatial sky continuum emission | Spatial sky telluric CO2 absorption deviations (filled: H < 10) | |||||||||||||||||||||||
| 0 | 0 |
|
|
|
|
|
|
| IPAIR | NAME | SHIFT | NEWSHIFT | S/N | NAME | SHIFT | NEWSHIFT | S/N |
| 0 | 06410073 | 0.441560 | 0.00000 | 285.174 | 06410071 | 0.0524131 | 0.389147 | 283.069 |
| 1 | 06410069 | 0.433562 | 0.00799799 | 291.397 | 06410068 | 0.00000 | 0.441560 | 291.956 |
| 2 | 06410074 | 0.438210 | 0.00334999 | 288.368 | 06410075 | 0.0540740 | 0.387486 | 290.830 |
| 3 | 06410070 | 0.436569 | 0.00499099 | 287.145 | 06410072 | 0.0544882 | 0.387072 | 283.485 |