| Red | Green | Blue | |
| z | 17.64 | ||
| znorm | Inf | ||
| sky | -Inf | -Inf | -Inf |
| S/N | 29.6 | 50.5 | 53.4 |
| S/N(c) | 0.0 | 0.0 | 0.0 |
| SN(E/C) |


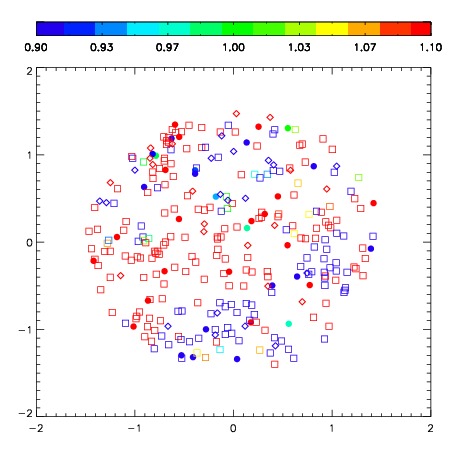

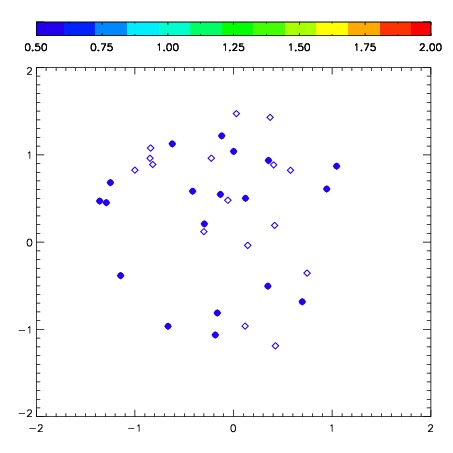
| Frame | Nreads | Zeropoints | Mag plots | Spatial mag deviation | Spatial sky 16325A emission deviations (filled: sky, open: star) | Spatial sky continuum emission | Spatial sky telluric CO2 absorption deviations (filled: H < 10) | |||||||||||||||||||||||
| 0 | 0 |
|
|
|
|
|
|
| IPAIR | NAME | SHIFT | NEWSHIFT | S/N | NAME | SHIFT | NEWSHIFT | S/N |
| 0 | 06700058 | 0.456553 | 0.00000 | 264.979 | 06700059 | 0.0282802 | 0.428273 | 264.239 |
| 1 | 06700057 | 0.452550 | 0.00400302 | 256.692 | 06700056 | 0.0258958 | 0.430657 | 259.259 |
| 2 | 06700053 | 0.439750 | 0.0168030 | 256.020 | 06700055 | 0.0267009 | 0.429852 | 256.083 |
| 3 | 06700054 | 0.450275 | 0.00627801 | 253.854 | 06700052 | 0.00000 | 0.456553 | 252.756 |