| Red | Green | Blue | |
| z | 17.64 | ||
| znorm | Inf | ||
| sky | -Inf | -NaN | -Inf |
| S/N | 27.8 | 45.0 | 50.9 |
| S/N(c) | 0.0 | 0.0 | 0.0 |
| SN(E/C) |
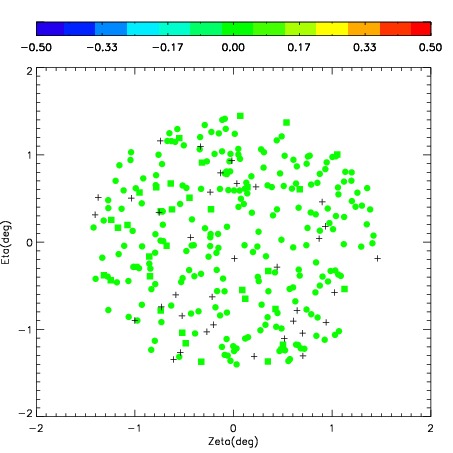


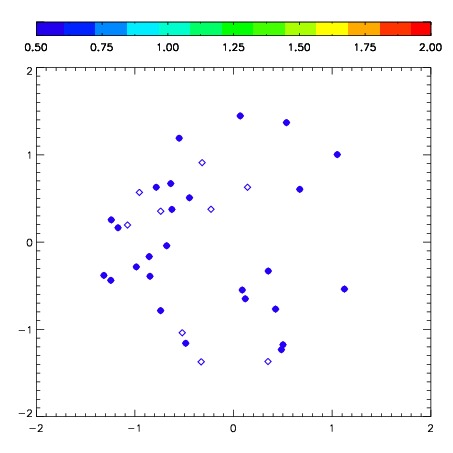
| Frame | Nreads | Zeropoints | Mag plots | Spatial mag deviation | Spatial sky 16325A emission deviations (filled: sky, open: star) | Spatial sky continuum emission | Spatial sky telluric CO2 absorption deviations (filled: H < 10) | |||||||||||||||||||||||
| 0 | 0 |
|
|
|
|
|
|
| IPAIR | NAME | SHIFT | NEWSHIFT | S/N | NAME | SHIFT | NEWSHIFT | S/N |
| 0 | 06430048 | 0.463776 | 0.00000 | 277.978 | 06430047 | 0.00000 | 0.463776 | 274.842 |
| 1 | 06430053 | 0.456009 | 0.00776699 | 279.434 | 06430054 | 0.0215077 | 0.442268 | 278.839 |
| 2 | 06430049 | 0.449961 | 0.0138150 | 277.974 | 06430050 | 0.0211915 | 0.442584 | 265.072 |
| 3 | 06430052 | 0.452711 | 0.0110650 | 271.266 | 06430051 | 0.0243736 | 0.439402 | 264.050 |