| Red | Green | Blue | |
| z | 17.64 | ||
| znorm | Inf | ||
| sky | -Inf | -Inf | -Inf |
| S/N | 23.2 | 42.2 | 46.7 |
| S/N(c) | 0.0 | 0.0 | 0.0 |
| SN(E/C) |


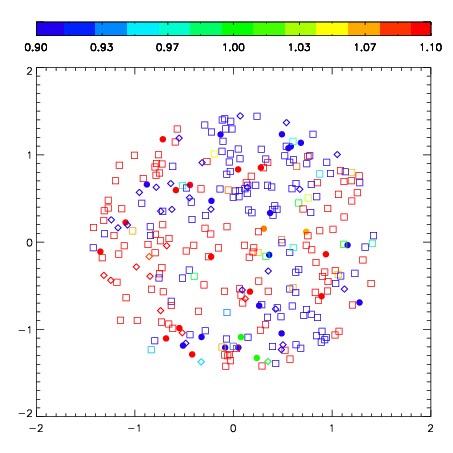
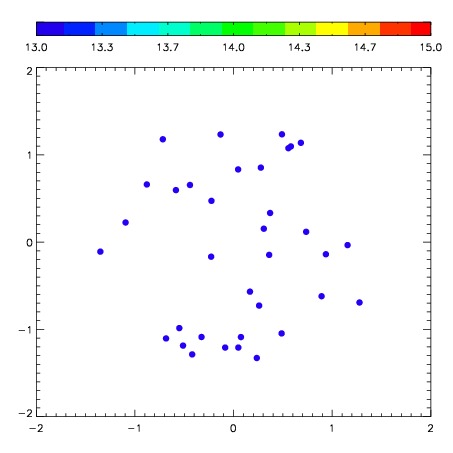
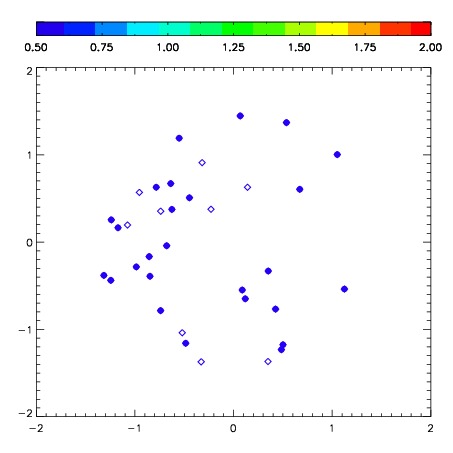
| Frame | Nreads | Zeropoints | Mag plots | Spatial mag deviation | Spatial sky 16325A emission deviations (filled: sky, open: star) | Spatial sky continuum emission | Spatial sky telluric CO2 absorption deviations (filled: H < 10) | |||||||||||||||||||||||
| 0 | 0 |
|
|
|
|
|
|
| IPAIR | NAME | SHIFT | NEWSHIFT | S/N | NAME | SHIFT | NEWSHIFT | S/N |
| 0 | 06080081 | 0.426367 | 0.00000 | 215.816 | 06080084 | -0.0172411 | 0.443608 | 220.450 |
| 1 | 06080085 | 0.417856 | 0.00851101 | 214.881 | 06080080 | 0.00000 | 0.426367 | 213.322 |
| 2 | 06080082 | 0.424398 | 0.00196901 | 213.726 | 06080083 | -0.0175083 | 0.443875 | 213.245 |
| 3 | 06080086 | 0.418512 | 0.00785503 | 183.921 | 06080087 | -0.0156688 | 0.442036 | 207.429 |