| Red | Green | Blue | |
| z | 17.64 | ||
| znorm | Inf | ||
| sky | -Inf | -Inf | -Inf |
| S/N | 29.0 | 49.5 | 53.6 |
| S/N(c) | 0.0 | 0.0 | 0.0 |
| SN(E/C) |

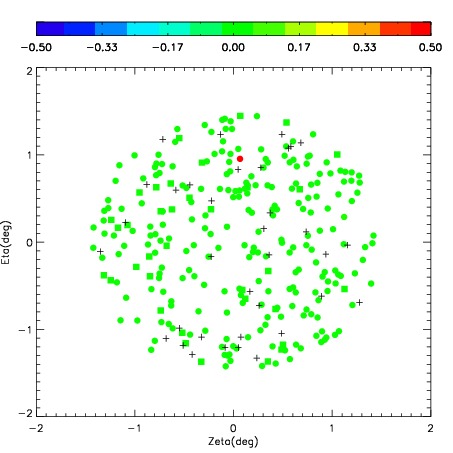
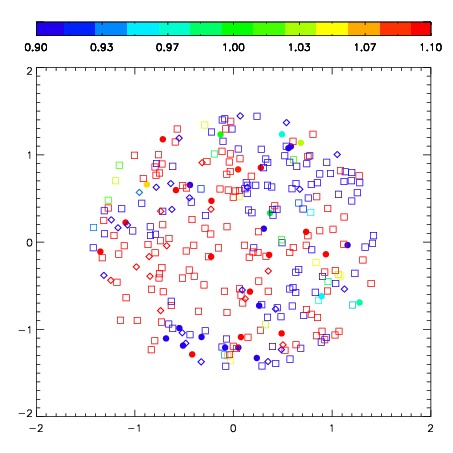
| Frame | Nreads | Zeropoints | Mag plots | Spatial mag deviation | Spatial sky 16325A emission deviations (filled: sky, open: star) | Spatial sky continuum emission | Spatial sky telluric CO2 absorption deviations (filled: H < 10) | |||||||||||||||||||||||
| 0 | 0 |
|
|
|
|
|
|
| IPAIR | NAME | SHIFT | NEWSHIFT | S/N | NAME | SHIFT | NEWSHIFT | S/N |
| 0 | 06440038 | 0.377674 | 0.00000 | 244.091 | 06440037 | 0.00000 | 0.377674 | 245.657 |
| 1 | 06440042 | 0.367333 | 0.0103410 | 252.497 | 06440044 | -0.0235045 | 0.401179 | 254.685 |
| 2 | 06440039 | 0.370386 | 0.00728801 | 250.809 | 06440041 | -0.0173992 | 0.395073 | 253.066 |
| 3 | 06440043 | 0.373911 | 0.00376302 | 247.813 | 06440040 | -0.0186259 | 0.396300 | 251.781 |