| Red | Green | Blue | |
| z | 17.64 | ||
| znorm | Inf | ||
| sky | -NaN | -Inf | -Inf |
| S/N | 27.5 | 46.9 | 50.8 |
| S/N(c) | 0.0 | 0.0 | 0.0 |
| SN(E/C) |

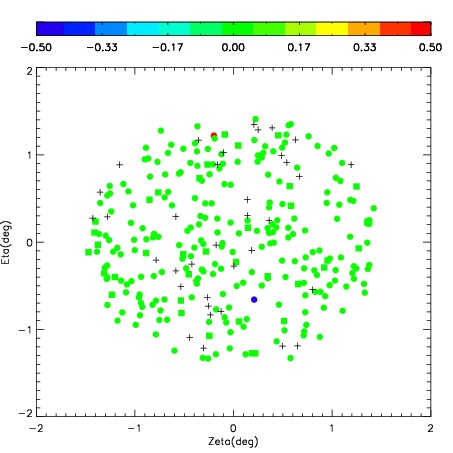


| Frame | Nreads | Zeropoints | Mag plots | Spatial mag deviation | Spatial sky 16325A emission deviations (filled: sky, open: star) | Spatial sky continuum emission | Spatial sky telluric CO2 absorption deviations (filled: H < 10) | |||||||||||||||||||||||
| 0 | 0 |
|
|
|
|
|
|
| IPAIR | NAME | SHIFT | NEWSHIFT | S/N | NAME | SHIFT | NEWSHIFT | S/N |
| 0 | 06380053 | 0.334976 | 0.00000 | 275.008 | 06380055 | -0.0475609 | 0.382537 | 272.061 |
| 1 | 06380058 | 0.319972 | 0.0150040 | 286.788 | 06380059 | -0.0467854 | 0.381761 | 286.789 |
| 2 | 06380057 | 0.324873 | 0.0101030 | 285.174 | 06380056 | -0.0320949 | 0.367071 | 281.449 |
| 3 | 06380054 | 0.331733 | 0.00324300 | 281.234 | 06380052 | 0.00000 | 0.334976 | 280.755 |