| Red | Green | Blue | |
| z | 17.64 | ||
| znorm | Inf | ||
| sky | -NaN | -NaN | -Inf |
| S/N | 28.4 | 48.6 | 52.1 |
| S/N(c) | 0.0 | 0.0 | 0.0 |
| SN(E/C) |


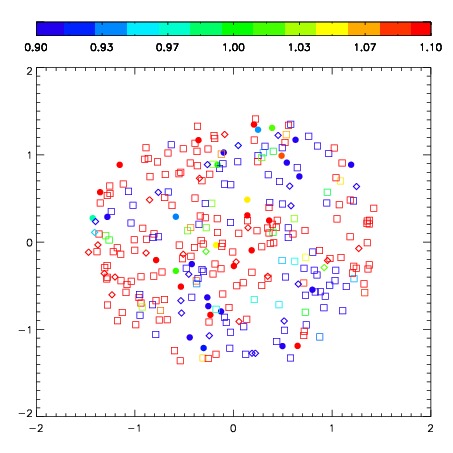


| Frame | Nreads | Zeropoints | Mag plots | Spatial mag deviation | Spatial sky 16325A emission deviations (filled: sky, open: star) | Spatial sky continuum emission | Spatial sky telluric CO2 absorption deviations (filled: H < 10) | |||||||||||||||||||||||
| 0 | 0 |
|
|
|
|
|
|
| IPAIR | NAME | SHIFT | NEWSHIFT | S/N | NAME | SHIFT | NEWSHIFT | S/N |
| 0 | 06640060 | 0.341311 | 0.00000 | 271.265 | 06640062 | -0.0517642 | 0.393075 | 274.798 |
| 1 | 06640063 | 0.327740 | 0.0135710 | 275.381 | 06640061 | -0.0507243 | 0.392035 | 276.417 |
| 2 | 06640064 | 0.332728 | 0.00858301 | 273.555 | 06640065 | -0.0534807 | 0.394792 | 276.197 |
| 3 | 06640059 | 0.330261 | 0.0110500 | 270.476 | 06640058 | 0.00000 | 0.341311 | 270.835 |