| Red | Green | Blue | |
| z | 17.64 | ||
| znorm | Inf | ||
| sky | -Inf | -NaN | -Inf |
| S/N | 27.9 | 48.7 | 52.6 |
| S/N(c) | 0.0 | 0.0 | 0.0 |
| SN(E/C) |

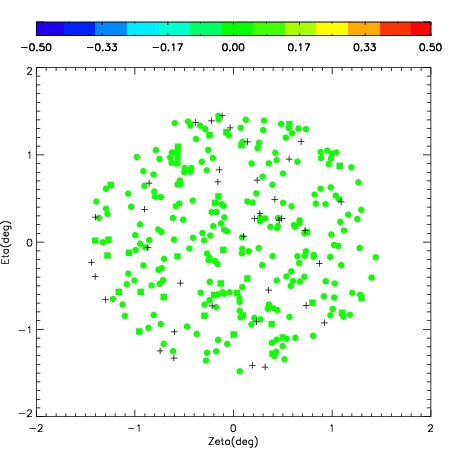


| Frame | Nreads | Zeropoints | Mag plots | Spatial mag deviation | Spatial sky 16325A emission deviations (filled: sky, open: star) | Spatial sky continuum emission | Spatial sky telluric CO2 absorption deviations (filled: H < 10) | |||||||||||||||||||||||
| 0 | 0 |
|
|
|
|
|
|
| IPAIR | NAME | SHIFT | NEWSHIFT | S/N | NAME | SHIFT | NEWSHIFT | S/N |
| 0 | 06380043 | 0.433741 | 0.00000 | 296.865 | 06380048 | 0.00215095 | 0.431590 | 299.489 |
| 1 | 06380046 | 0.420288 | 0.0134530 | 299.382 | 06380045 | 0.0231428 | 0.410598 | 299.962 |
| 2 | 06380047 | 0.415323 | 0.0184180 | 297.505 | 06380044 | 0.0112925 | 0.422449 | 299.634 |
| 3 | 06380042 | 0.433417 | 0.000324011 | 295.717 | 06380041 | 0.00000 | 0.433741 | 287.933 |