| Red | Green | Blue | |
| z | 17.64 | ||
| znorm | Inf | ||
| sky | -Inf | -Inf | -Inf |
| S/N | 27.3 | 44.1 | 50.7 |
| S/N(c) | 0.0 | 0.0 | 0.0 |
| SN(E/C) |


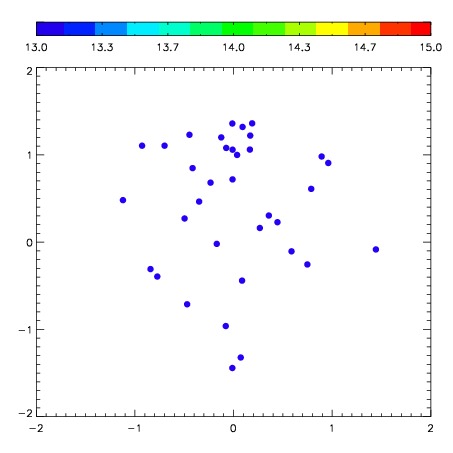
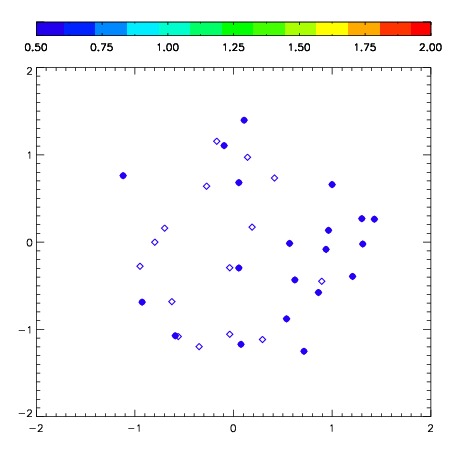
| Frame | Nreads | Zeropoints | Mag plots | Spatial mag deviation | Spatial sky 16325A emission deviations (filled: sky, open: star) | Spatial sky continuum emission | Spatial sky telluric CO2 absorption deviations (filled: H < 10) | |||||||||||||||||||||||
| 0 | 0 |
|
|
|
|
|
|
| IPAIR | NAME | SHIFT | NEWSHIFT | S/N | NAME | SHIFT | NEWSHIFT | S/N |
| 0 | 07210038 | 0.493458 | 0.00000 | 281.312 | 07210040 | 0.0377062 | 0.455752 | 279.893 |
| 1 | 07210039 | 0.493155 | 0.000303000 | 278.812 | 07210037 | 0.00000 | 0.493458 | 272.944 |
| 2 | 07210043 | 0.492700 | 0.000757992 | 266.444 | 07210044 | 0.0368273 | 0.456631 | 261.527 |
| 3 | 07210042 | 0.493139 | 0.000319004 | 265.091 | 07210041 | 0.0379568 | 0.455501 | 257.030 |