| Red | Green | Blue | |
| z | 17.64 | ||
| znorm | Inf | ||
| sky | -Inf | -NaN | -Inf |
| S/N | 27.0 | 47.0 | 50.7 |
| S/N(c) | 0.0 | 0.0 | 0.0 |
| SN(E/C) |

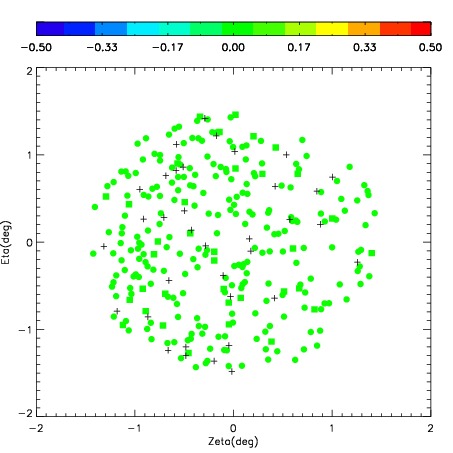
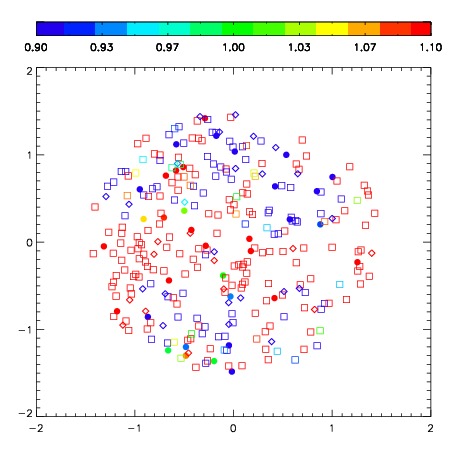


| Frame | Nreads | Zeropoints | Mag plots | Spatial mag deviation | Spatial sky 16325A emission deviations (filled: sky, open: star) | Spatial sky continuum emission | Spatial sky telluric CO2 absorption deviations (filled: H < 10) | |||||||||||||||||||||||
| 0 | 0 |
|
|
|
|
|
|
| IPAIR | NAME | SHIFT | NEWSHIFT | S/N | NAME | SHIFT | NEWSHIFT | S/N |
| 0 | 06690030 | 0.474757 | 0.00000 | 245.551 | 06690033 | 0.0223629 | 0.452394 | 242.444 |
| 1 | 06690035 | 0.472611 | 0.00214598 | 242.724 | 06690032 | 0.0219273 | 0.452830 | 242.281 |
| 2 | 06690034 | 0.467236 | 0.00752097 | 241.722 | 06690036 | 0.0229729 | 0.451784 | 240.395 |
| 3 | 06690031 | 0.471865 | 0.00289199 | 240.816 | 06690029 | 0.00000 | 0.474757 | 239.070 |