| Red | Green | Blue | |
| z | 17.64 | ||
| znorm | Inf | ||
| sky | -Inf | -Inf | -Inf |
| S/N | 28.3 | 46.4 | 51.7 |
| S/N(c) | 0.0 | 0.0 | 0.0 |
| SN(E/C) |

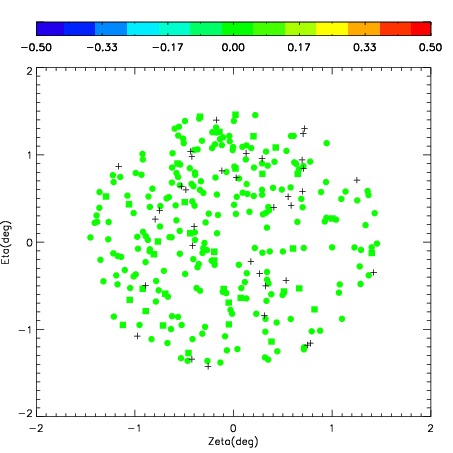

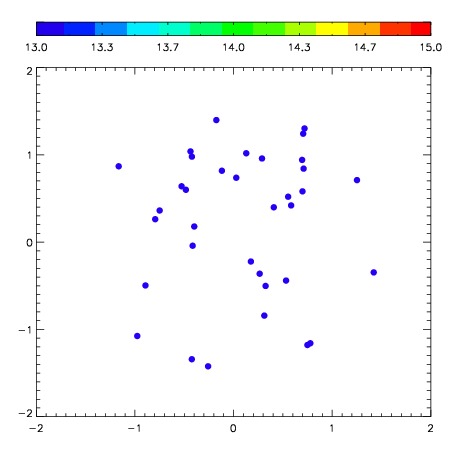
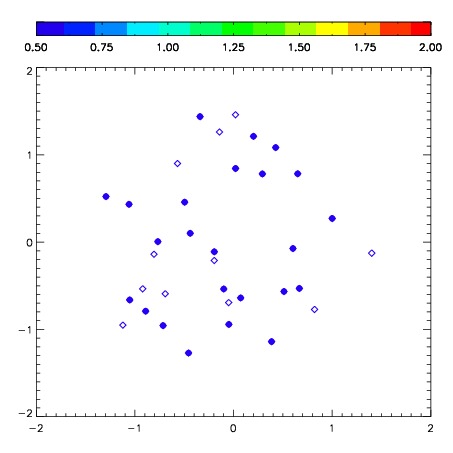
| Frame | Nreads | Zeropoints | Mag plots | Spatial mag deviation | Spatial sky 16325A emission deviations (filled: sky, open: star) | Spatial sky continuum emission | Spatial sky telluric CO2 absorption deviations (filled: H < 10) | |||||||||||||||||||||||
| 0 | 0 |
|
|
|
|
|
|
| IPAIR | NAME | SHIFT | NEWSHIFT | S/N | NAME | SHIFT | NEWSHIFT | S/N |
| 0 | 06440017 | 0.462244 | 0.00000 | 298.530 | 06440015 | 0.0291950 | 0.433049 | 301.479 |
| 1 | 06440012 | 0.457539 | 0.00470501 | 300.729 | 06440018 | 0.0275699 | 0.434674 | 305.477 |
| 2 | 06440013 | 0.460858 | 0.00138602 | 299.706 | 06440014 | 0.0310410 | 0.431203 | 302.102 |
| 3 | 06440016 | 0.454540 | 0.00770399 | 298.315 | 06440011 | 0.00000 | 0.462244 | 301.451 |