| Red | Green | Blue | |
| z | 17.64 | ||
| znorm | Inf | ||
| sky | -NaN | -NaN | -Inf |
| S/N | 25.4 | 41.0 | 43.5 |
| S/N(c) | 0.0 | 0.0 | 0.0 |
| SN(E/C) |

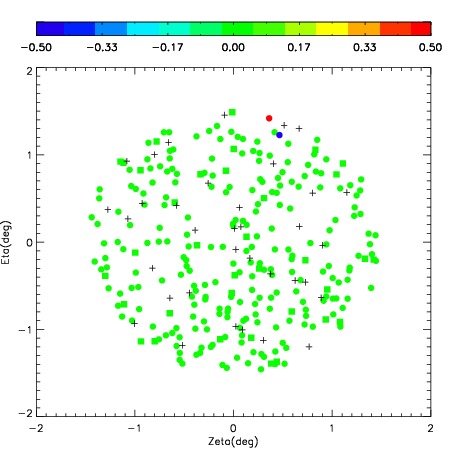
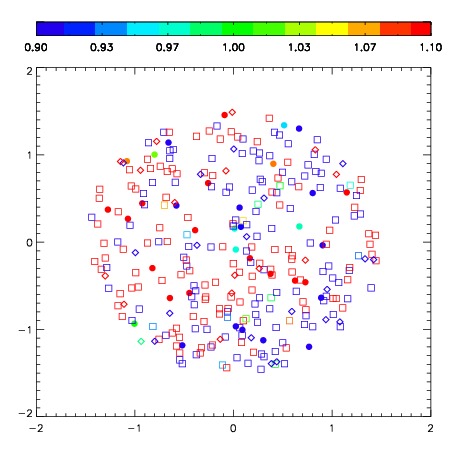
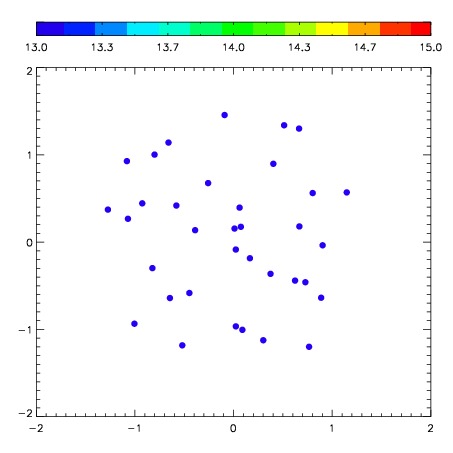

| Frame | Nreads | Zeropoints | Mag plots | Spatial mag deviation | Spatial sky 16325A emission deviations (filled: sky, open: star) | Spatial sky continuum emission | Spatial sky telluric CO2 absorption deviations (filled: H < 10) | |||||||||||||||||||||||
| 0 | 0 |
|
|
|
|
|
|
| IPAIR | NAME | SHIFT | NEWSHIFT | S/N | NAME | SHIFT | NEWSHIFT | S/N |
| 0 | 06470021 | 0.296027 | 0.00000 | 230.572 | 06470022 | -0.0346952 | 0.330722 | 231.192 |
| 1 | 06470020 | 0.292090 | 0.00393701 | 231.293 | 06470023 | -0.0332576 | 0.329285 | 232.146 |
| 2 | 06470024 | 0.288047 | 0.00798002 | 229.506 | 06470019 | 0.00000 | 0.296027 | 228.952 |
| 3 | 06470025 | 0.293715 | 0.00231200 | 228.154 | 06470026 | -0.0370775 | 0.333104 | 222.234 |