| Red | Green | Blue | |
| z | 17.64 | ||
| znorm | Inf | ||
| sky | -NaN | -Inf | -Inf |
| S/N | 23.2 | 38.8 | 45.3 |
| S/N(c) | 0.0 | 0.0 | 0.0 |
| SN(E/C) |


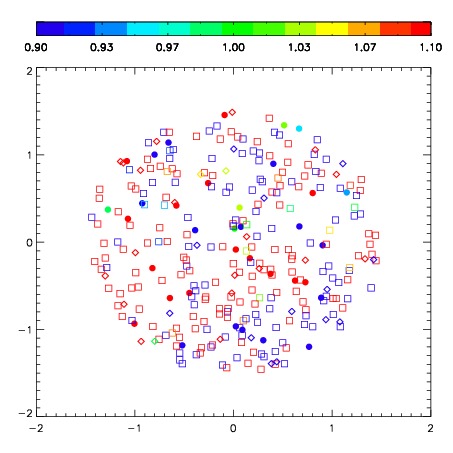
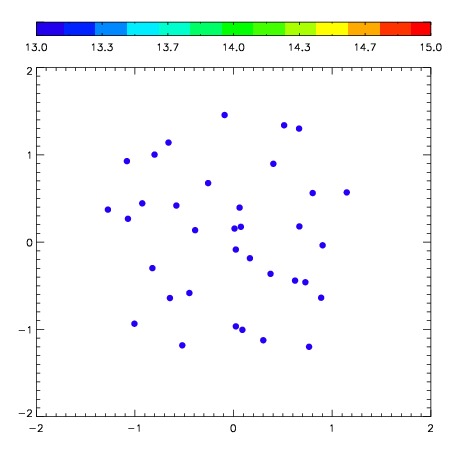
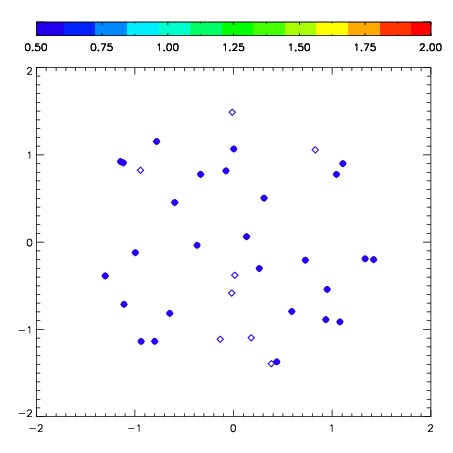
| Frame | Nreads | Zeropoints | Mag plots | Spatial mag deviation | Spatial sky 16325A emission deviations (filled: sky, open: star) | Spatial sky continuum emission | Spatial sky telluric CO2 absorption deviations (filled: H < 10) | |||||||||||||||||||||||
| 0 | 0 |
|
|
|
|
|
|
| IPAIR | NAME | SHIFT | NEWSHIFT | S/N | NAME | SHIFT | NEWSHIFT | S/N |
| 0 | 06630058 | 0.346381 | 0.00000 | 204.348 | 06630056 | 0.00000 | 0.346381 | 206.293 |
| 1 | 06630062 | 0.343408 | 0.00297302 | 211.548 | 06630063 | -0.0279348 | 0.374316 | 210.493 |
| 2 | 06630061 | 0.339430 | 0.00695100 | 205.252 | 06630060 | -0.0257927 | 0.372174 | 206.471 |
| 3 | 06630057 | 0.340059 | 0.00632200 | 203.129 | 06630059 | -0.0251218 | 0.371503 | 201.065 |