| Red | Green | Blue | |
| z | 17.64 | ||
| znorm | Inf | ||
| sky | -NaN | -NaN | -Inf |
| S/N | 31.1 | 50.7 | 56.6 |
| S/N(c) | 0.0 | 0.0 | 0.0 |
| SN(E/C) |
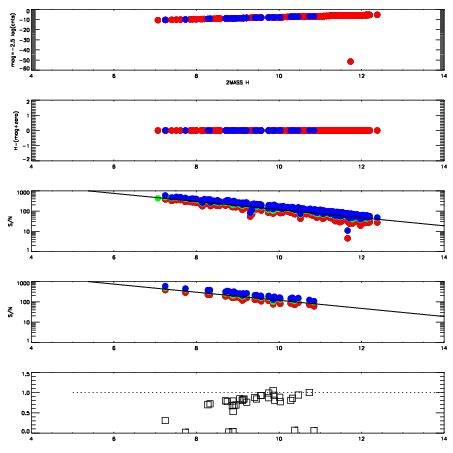
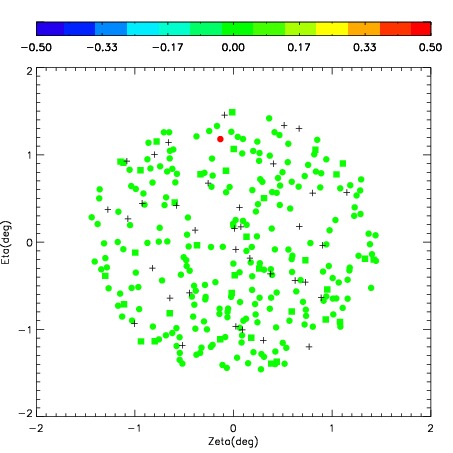

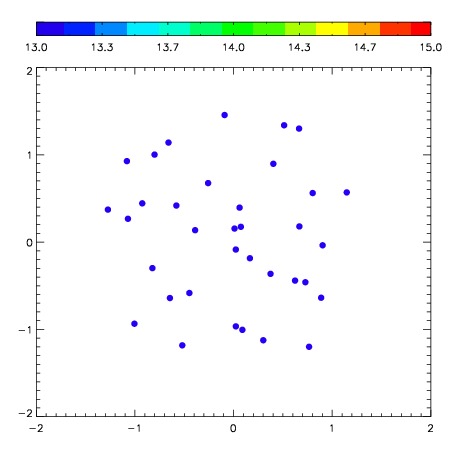
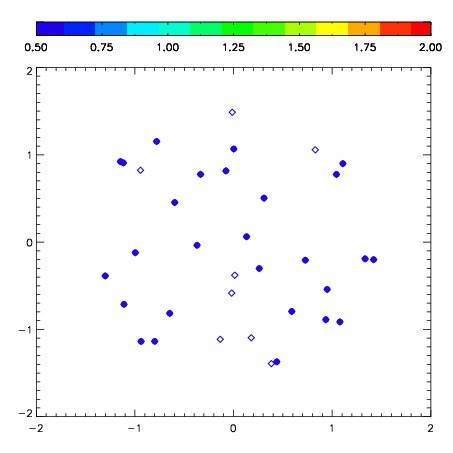
| Frame | Nreads | Zeropoints | Mag plots | Spatial mag deviation | Spatial sky 16325A emission deviations (filled: sky, open: star) | Spatial sky continuum emission | Spatial sky telluric CO2 absorption deviations (filled: H < 10) | |||||||||||||||||||||||
| 0 | 0 |
|
|
|
|
|
|
| IPAIR | NAME | SHIFT | NEWSHIFT | S/N | NAME | SHIFT | NEWSHIFT | S/N |
| 0 | 06730043 | 0.477218 | 0.00000 | 214.485 | 06730037 | 0.00000 | 0.477218 | 215.515 |
| 1 | 06730042 | 0.470598 | 0.00661999 | 214.533 | 06730044 | 0.0170510 | 0.460167 | 218.704 |
| 2 | 06730038 | 0.466673 | 0.0105450 | 212.827 | 06730040 | 0.00857198 | 0.468646 | 213.105 |
| 3 | 06730039 | 0.459212 | 0.0180060 | 212.572 | 06730041 | 0.00876939 | 0.468449 | 210.702 |