| Red | Green | Blue | |
| z | 17.64 | ||
| znorm | Inf | ||
| sky | -Inf | -Inf | -Inf |
| S/N | 26.2 | 44.9 | 49.3 |
| S/N(c) | 0.0 | 0.0 | 0.0 |
| SN(E/C) |
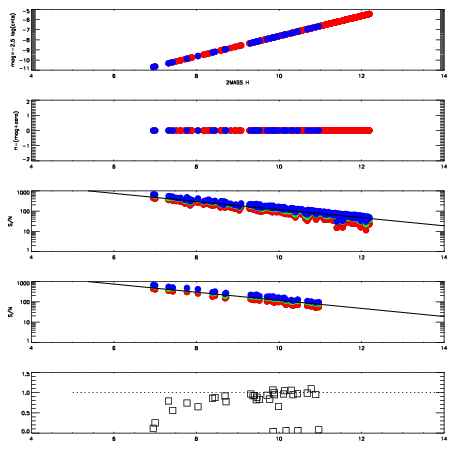


| Frame | Nreads | Zeropoints | Mag plots | Spatial mag deviation | Spatial sky 16325A emission deviations (filled: sky, open: star) | Spatial sky continuum emission | Spatial sky telluric CO2 absorption deviations (filled: H < 10) | |||||||||||||||||||||||
| 0 | 0 |
|
|
|
|
|
|
| IPAIR | NAME | SHIFT | NEWSHIFT | S/N | NAME | SHIFT | NEWSHIFT | S/N |
| 0 | 06670076 | 0.421034 | 0.00000 | 229.161 | 06670070 | 0.00000 | 0.421034 | 227.635 |
| 1 | 06670075 | 0.420909 | 0.000125021 | 232.193 | 06670073 | 0.00826353 | 0.412770 | 232.818 |
| 2 | 06670072 | 0.418534 | 0.00250000 | 231.379 | 06670074 | 0.00516306 | 0.415871 | 231.919 |
| 3 | 06670071 | 0.419786 | 0.00124800 | 223.527 | 06670077 | 0.00713468 | 0.413899 | 215.173 |