| Red | Green | Blue | |
| z | 17.64 | ||
| znorm | Inf | ||
| sky | -Inf | -Inf | -Inf |
| S/N | 27.4 | 46.1 | 53.2 |
| S/N(c) | 0.0 | 0.0 | 0.0 |
| SN(E/C) |

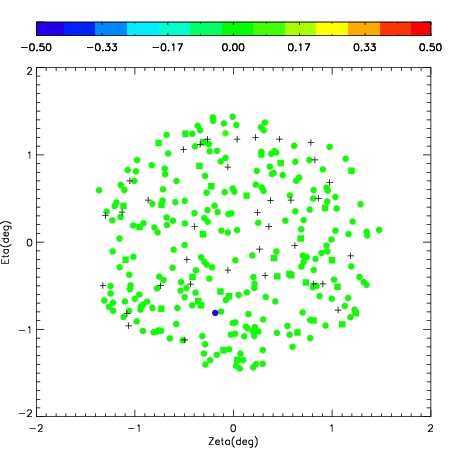


| Frame | Nreads | Zeropoints | Mag plots | Spatial mag deviation | Spatial sky 16325A emission deviations (filled: sky, open: star) | Spatial sky continuum emission | Spatial sky telluric CO2 absorption deviations (filled: H < 10) | |||||||||||||||||||||||
| 0 | 0 |
|
|
|
|
|
|
| IPAIR | NAME | SHIFT | NEWSHIFT | S/N | NAME | SHIFT | NEWSHIFT | S/N |
| 0 | 06970067 | 0.424798 | 0.00000 | 275.354 | 06970068 | 0.0356939 | 0.389104 | 270.864 |
| 1 | 06970066 | 0.424283 | 0.000515014 | 269.254 | 06970064 | 0.0304846 | 0.394313 | 265.514 |
| 2 | 06970063 | 0.423428 | 0.00137001 | 261.132 | 06970065 | 0.0306505 | 0.394148 | 263.588 |
| 3 | 06970062 | 0.410371 | 0.0144270 | 258.817 | 06970061 | 0.00000 | 0.424798 | 257.885 |