| Red | Green | Blue | |
| z | 17.64 | ||
| znorm | Inf | ||
| sky | -NaN | -NaN | -Inf |
| S/N | 22.9 | 37.8 | 43.8 |
| S/N(c) | 0.0 | 0.0 | 0.0 |
| SN(E/C) |

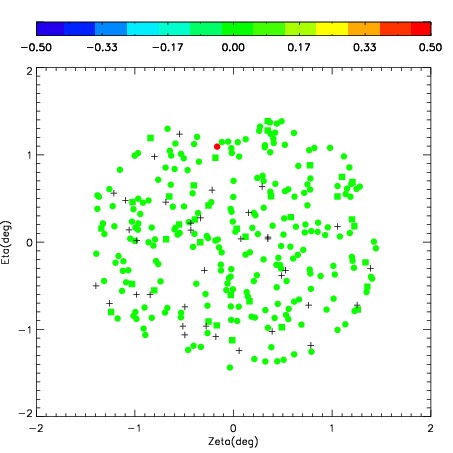


| Frame | Nreads | Zeropoints | Mag plots | Spatial mag deviation | Spatial sky 16325A emission deviations (filled: sky, open: star) | Spatial sky continuum emission | Spatial sky telluric CO2 absorption deviations (filled: H < 10) | |||||||||||||||||||||||
| 0 | 0 |
|
|
|
|
|
|
| IPAIR | NAME | SHIFT | NEWSHIFT | S/N | NAME | SHIFT | NEWSHIFT | S/N |
| 0 | 07030037 | 0.354083 | 0.00000 | 250.235 | 07030040 | 0.0155742 | 0.338509 | 253.031 |
| 1 | 07030042 | 0.348499 | 0.00558400 | 257.694 | 07030043 | 0.0181092 | 0.335974 | 255.157 |
| 2 | 07030041 | 0.350123 | 0.00396001 | 254.728 | 07030036 | 0.00000 | 0.354083 | 253.149 |
| 3 | 07030038 | 0.350269 | 0.00381401 | 249.427 | 07030039 | 0.0194467 | 0.334636 | 239.091 |