| Red | Green | Blue | |
| z | 17.64 | ||
| znorm | Inf | ||
| sky | -Inf | -Inf | -Inf |
| S/N | 14.0 | 25.5 | 27.4 |
| S/N(c) | 0.0 | 0.0 | 0.0 |
| SN(E/C) |
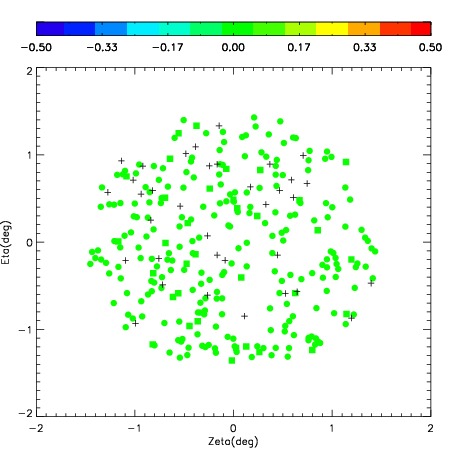
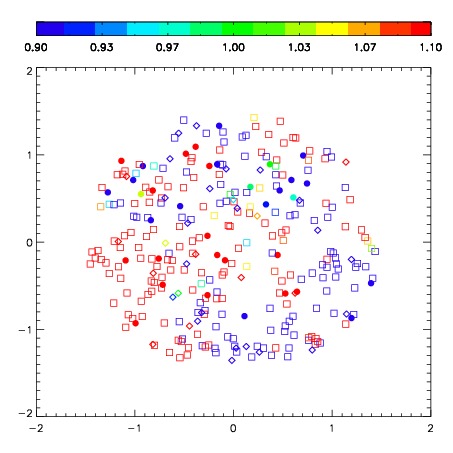
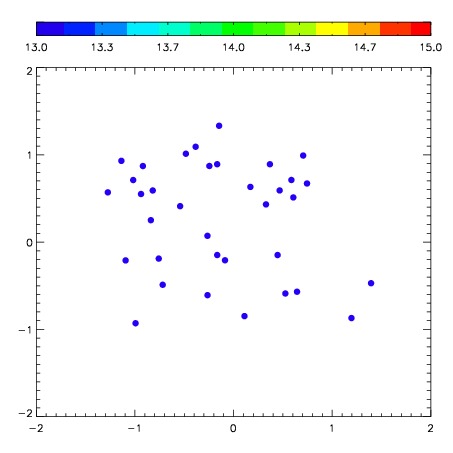

| Frame | Nreads | Zeropoints | Mag plots | Spatial mag deviation | Spatial sky 16325A emission deviations (filled: sky, open: star) | Spatial sky continuum emission | Spatial sky telluric CO2 absorption deviations (filled: H < 10) | |||||||||||||||||||||||
| 0 | 0 |
|
|
|
|
|
|
| IPAIR | NAME | SHIFT | NEWSHIFT | S/N | NAME | SHIFT | NEWSHIFT | S/N |
| 0 | 08100017 | 0.466698 | 0.00000 | 155.416 | 08100018 | -0.0305297 | 0.497228 | 139.669 |
| 1 | 08100012 | 0.446930 | 0.0197680 | 217.181 | 08100011 | 0.00000 | 0.466698 | 216.623 |
| 2 | 08100013 | 0.456337 | 0.0103610 | 209.728 | 08100015 | -0.0235562 | 0.490254 | 206.274 |
| 3 | 08100016 | 0.462314 | 0.00438398 | 184.606 | 08100014 | -0.0227509 | 0.489449 | 198.478 |