| Red | Green | Blue | |
| z | 17.64 | ||
| znorm | Inf | ||
| sky | -Inf | -Inf | -Inf |
| S/N | 33.7 | 57.7 | 62.9 |
| S/N(c) | 0.0 | 0.0 | 0.0 |
| SN(E/C) |

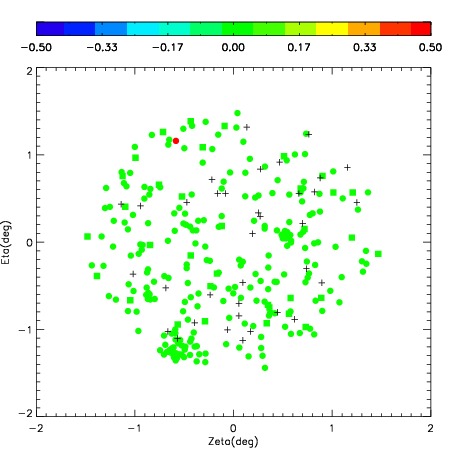
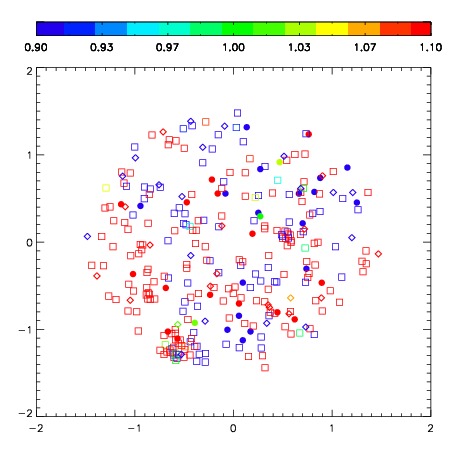
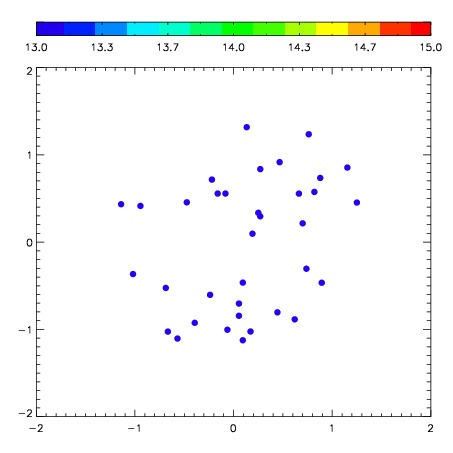
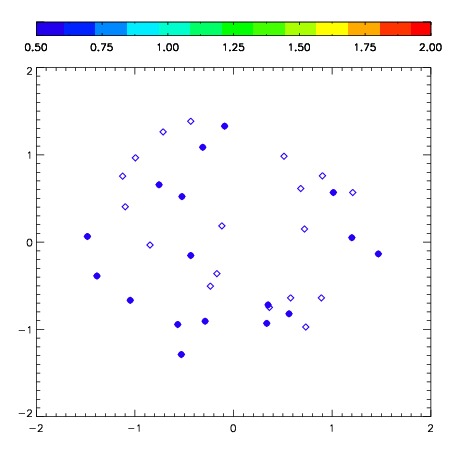
| Frame | Nreads | Zeropoints | Mag plots | Spatial mag deviation | Spatial sky 16325A emission deviations (filled: sky, open: star) | Spatial sky continuum emission | Spatial sky telluric CO2 absorption deviations (filled: H < 10) | |||||||||||||||||||||||
| 0 | 0 |
|
|
|
|
|
|
| IPAIR | NAME | SHIFT | NEWSHIFT | S/N | NAME | SHIFT | NEWSHIFT | S/N |
| 0 | 06990083 | 0.477008 | 0.00000 | 246.620 | 06990081 | 0.0383954 | 0.438613 | 244.711 |
| 1 | 06990087 | 0.471960 | 0.00504798 | 247.012 | 06990084 | 0.0363688 | 0.440639 | 246.762 |
| 2 | 06990086 | 0.471843 | 0.00516498 | 245.818 | 06990085 | 0.0383033 | 0.438705 | 243.703 |
| 3 | 06990082 | 0.469541 | 0.00746697 | 245.129 | 06990088 | 0.0374117 | 0.439596 | 243.514 |
| 4 | 06990079 | 0.470343 | 0.00666499 | 242.235 | 06990080 | 0.0395272 | 0.437481 | 240.845 |
| 5 | 06990078 | 0.464221 | 0.0127870 | 237.809 | 06990077 | 0.00000 | 0.477008 | 231.728 |