| Red | Green | Blue | |
| z | 17.64 | ||
| znorm | Inf | ||
| sky | -Inf | -Inf | -Inf |
| S/N | 26.6 | 48.9 | 51.8 |
| S/N(c) | 0.0 | 0.0 | 0.0 |
| SN(E/C) |

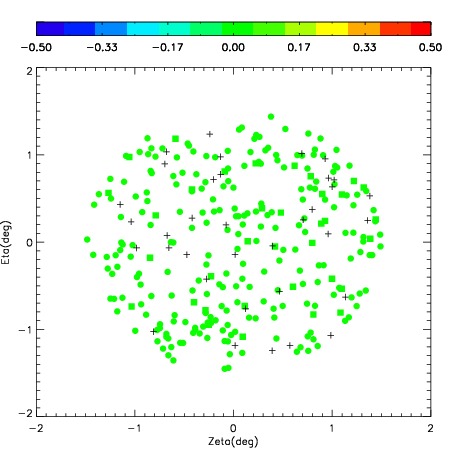
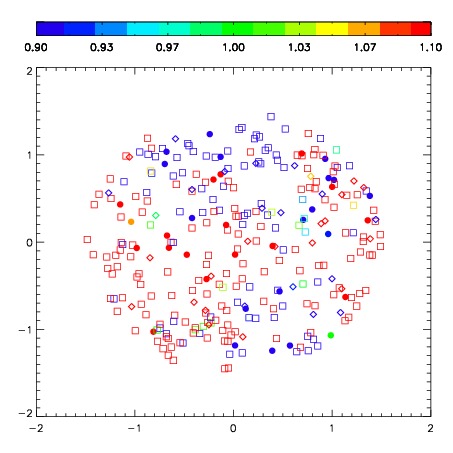


| Frame | Nreads | Zeropoints | Mag plots | Spatial mag deviation | Spatial sky 16325A emission deviations (filled: sky, open: star) | Spatial sky continuum emission | Spatial sky telluric CO2 absorption deviations (filled: H < 10) | |||||||||||||||||||||||
| 0 | 0 |
|
|
|
|
|
|
| IPAIR | NAME | SHIFT | NEWSHIFT | S/N | NAME | SHIFT | NEWSHIFT | S/N |
| 0 | 06660091 | 0.452228 | 0.00000 | 264.975 | 06660089 | 0.00000 | 0.452228 | 257.994 |
| 1 | 06660090 | 0.448444 | 0.00378400 | 268.247 | 06660093 | 0.00253057 | 0.449697 | 264.231 |
| 2 | 06660094 | 0.447568 | 0.00466001 | 266.706 | 06660092 | -0.00130320 | 0.453531 | 261.191 |
| 3 | 06660095 | 0.447209 | 0.00501901 | 259.470 | 06660096 | 0.00384334 | 0.448385 | 249.307 |
| 4 | 06660098 | 0.448646 | 0.00358200 | 234.626 | 06660097 | -0.00514068 | 0.457369 | 246.278 |
| 5 | 06660100 | 0.448305 | 0.00392300 | 209.192 | 06660099 | 0.000380382 | 0.451848 | 225.014 |