| Red | Green | Blue | |
| z | 17.64 | ||
| znorm | Inf | ||
| sky | -Inf | -Inf | -Inf |
| S/N | 25.3 | 44.0 | 48.7 |
| S/N(c) | 0.0 | 0.0 | 0.0 |
| SN(E/C) |

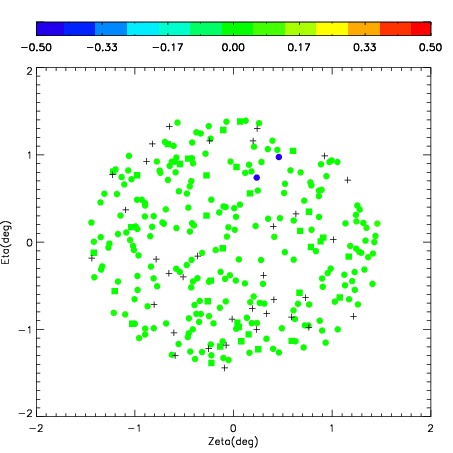
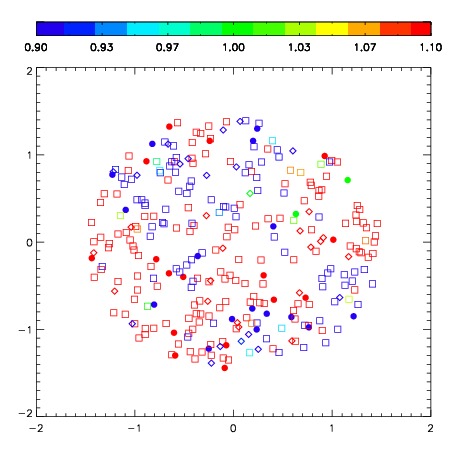

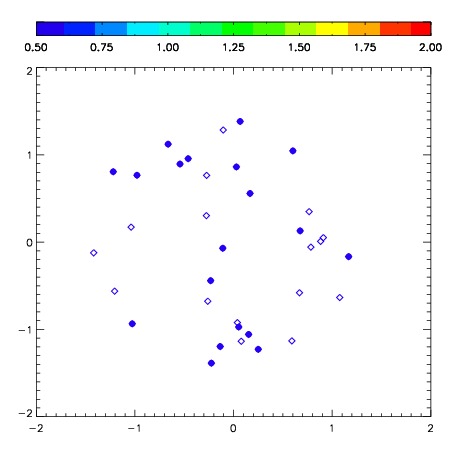
| Frame | Nreads | Zeropoints | Mag plots | Spatial mag deviation | Spatial sky 16325A emission deviations (filled: sky, open: star) | Spatial sky continuum emission | Spatial sky telluric CO2 absorption deviations (filled: H < 10) | |||||||||||||||||||||||
| 0 | 0 |
|
|
|
|
|
|
| IPAIR | NAME | SHIFT | NEWSHIFT | S/N | NAME | SHIFT | NEWSHIFT | S/N |
| 0 | 06420091 | 0.496217 | 0.00000 | 237.651 | 06420088 | 0.0516703 | 0.444547 | 260.510 |
| 1 | 06420087 | 0.487609 | 0.00860801 | 264.581 | 06420085 | 0.00000 | 0.496217 | 267.136 |
| 2 | 06420090 | 0.494631 | 0.00158602 | 258.109 | 06420092 | 0.0492518 | 0.446965 | 265.823 |
| 3 | 06420086 | 0.485394 | 0.0108230 | 251.366 | 06420089 | 0.0436273 | 0.452590 | 265.579 |