| Red | Green | Blue | |
| z | 17.64 | ||
| znorm | Inf | ||
| sky | -Inf | -NaN | -Inf |
| S/N | 25.0 | 42.8 | 54.7 |
| S/N(c) | 0.0 | 0.0 | 0.0 |
| SN(E/C) |

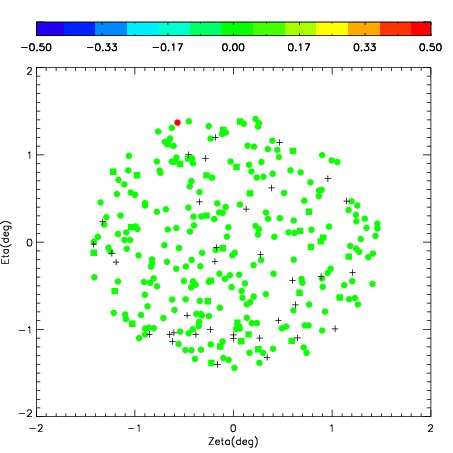

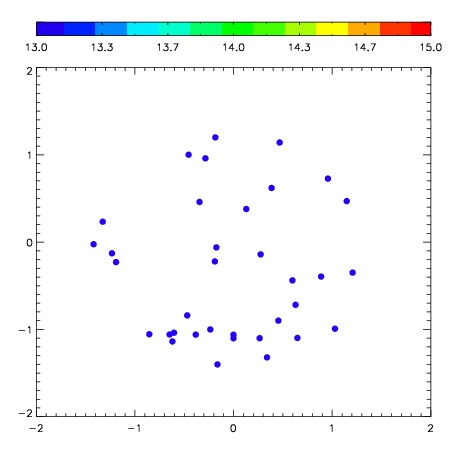

| Frame | Nreads | Zeropoints | Mag plots | Spatial mag deviation | Spatial sky 16325A emission deviations (filled: sky, open: star) | Spatial sky continuum emission | Spatial sky telluric CO2 absorption deviations (filled: H < 10) | |||||||||||||||||||||||
| 0 | 0 |
|
|
|
|
|
|
| IPAIR | NAME | SHIFT | NEWSHIFT | S/N | NAME | SHIFT | NEWSHIFT | S/N |
| 0 | 06430060 | 0.479606 | 0.00000 | 168.283 | 06430058 | 0.00000 | 0.479606 | 166.713 |
| 1 | 06430064 | 0.472657 | 0.00694901 | 176.666 | 06430065 | 0.0299358 | 0.449670 | 175.142 |
| 2 | 06430063 | 0.474039 | 0.00556701 | 176.255 | 06430062 | 0.0368856 | 0.442720 | 169.095 |
| 3 | 06430059 | 0.474875 | 0.00473100 | 168.271 | 06430061 | 0.0341235 | 0.445482 | 163.587 |