| Red | Green | Blue | |
| z | 17.64 | ||
| znorm | Inf | ||
| sky | -NaN | -NaN | -NaN |
| S/N | 26.5 | 42.3 | 49.6 |
| S/N(c) | 0.0 | 0.0 | 0.0 |
| SN(E/C) |

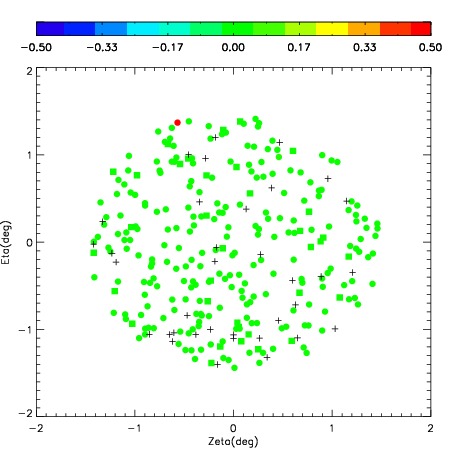
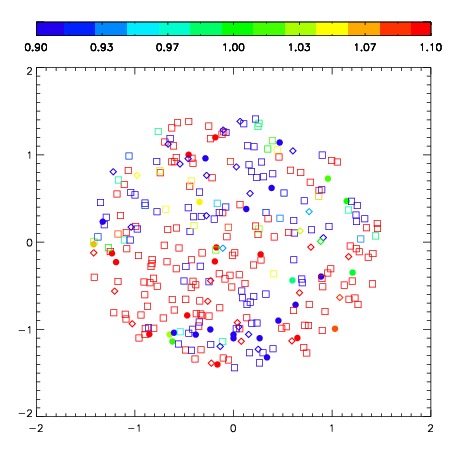
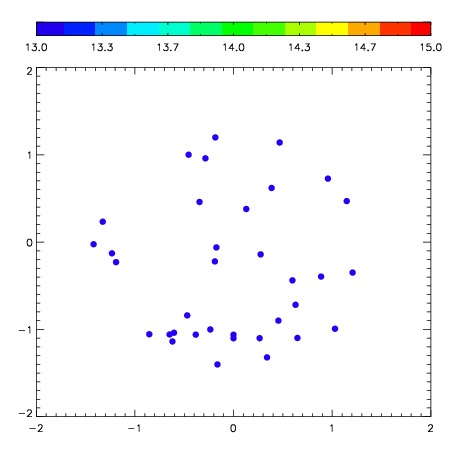
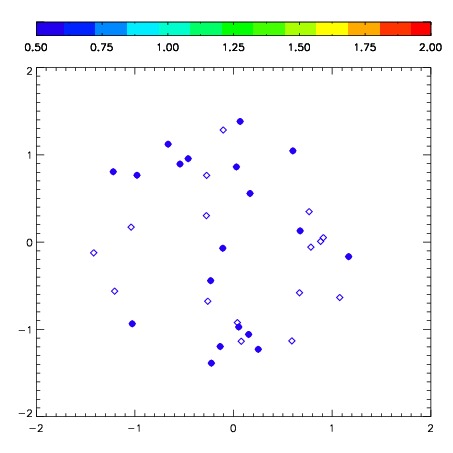
| Frame | Nreads | Zeropoints | Mag plots | Spatial mag deviation | Spatial sky 16325A emission deviations (filled: sky, open: star) | Spatial sky continuum emission | Spatial sky telluric CO2 absorption deviations (filled: H < 10) | |||||||||||||||||||||||
| 0 | 0 |
|
|
|
|
|
|
| IPAIR | NAME | SHIFT | NEWSHIFT | S/N | NAME | SHIFT | NEWSHIFT | S/N |
| 0 | 06690079 | 0.466612 | 0.00000 | 165.895 | 06690073 | 0.00000 | 0.466612 | 164.302 |
| 1 | 06690078 | 0.461205 | 0.00540701 | 172.534 | 06690077 | 0.0295347 | 0.437077 | 171.467 |
| 2 | 06690075 | 0.463770 | 0.00284201 | 172.518 | 06690076 | 0.0263979 | 0.440214 | 169.753 |
| 3 | 06690074 | 0.464317 | 0.00229502 | 163.818 | 06690080 | 0.0336017 | 0.433010 | 163.836 |