| Red | Green | Blue | |
| z | 17.64 | ||
| znorm | Inf | ||
| sky | -Inf | -Inf | -Inf |
| S/N | 28.2 | 47.8 | 54.1 |
| S/N(c) | 0.0 | 0.0 | 0.0 |
| SN(E/C) |


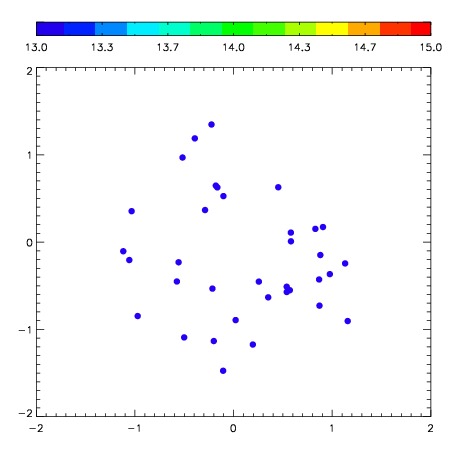
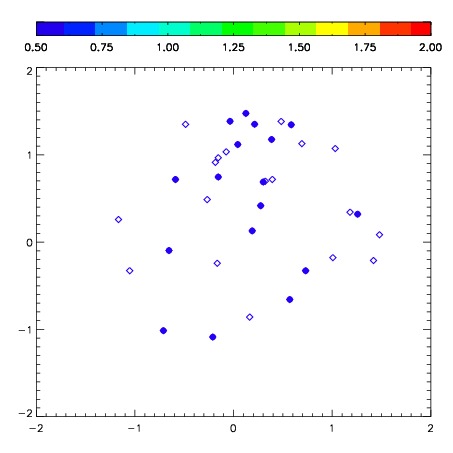
| Frame | Nreads | Zeropoints | Mag plots | Spatial mag deviation | Spatial sky 16325A emission deviations (filled: sky, open: star) | Spatial sky continuum emission | Spatial sky telluric CO2 absorption deviations (filled: H < 10) | |||||||||||||||||||||||
| 0 | 0 |
|
|
|
|
|
|
| IPAIR | NAME | SHIFT | NEWSHIFT | S/N | NAME | SHIFT | NEWSHIFT | S/N |
| 0 | 06440064 | 0.659600 | 0.00000 | 234.507 | 06440063 | 0.183578 | 0.476022 | 234.322 |
| 1 | 06440060 | 0.621531 | 0.0380690 | 275.442 | 06440066 | 0.187164 | 0.472436 | 280.389 |
| 2 | 06440061 | 0.635594 | 0.0240060 | 274.803 | 06440059 | 0.00000 | 0.659600 | 275.279 |
| 3 | 06440065 | 0.624752 | 0.0348480 | 271.264 | 06440062 | 0.181174 | 0.478426 | 274.941 |